3,201
Views
25
CrossRef citations to date
0
Altmetric
Research Paper

Pathophysiological mechanisms of diarrhea caused by the Vibrio cholerae O1 El Tor variant: an in vivo study in mice

, , , &
Pages 789-805 | Received 11 Jan 2016, Accepted 16 May 2016, Published online: 17 Jun 2016

Figures & data

Figure 1. Roles of CFTR and CaCC in EL-induced intestinal fluid secretion and the effect of EL infection on intestinal barrier disruption. (A) Contribution of CFTR and CaCC to EL-induced intestinal fluid secretion. Ileal loops were inoculated with EL or CL (105 CFU/loop) with or without intraperitoneal administration of CFTRinh-172, CaCCinh-A01 or CFTRinh-172 plus CaCCinh-A01. At 12 h after bacterial challenge, ileal loops were removed for measurements of loop weight/length ratio. Data are expressed as means of weight/length ratio ± SEM ***, p < 0.001 compared with PBS-instilled group; ###, p < 0.001 compared with EL-infected group; ΔΔ, p < 0.01 compared with CL-infected group using one-way ANOVA with Tukey's post hoc test (n = 4–9 mice per group). (B) Effect of EL infection on intestinal barrier function. At 12 h after inoculation with EL with or without CFTRinh-172 plus CaCCinh-A01 or CL, FITC-dextran flux assays were performed. Data are expressed as means of FITC-dextran concentrations ± SEM. ***, p < 0.001 compared with PBS-instilled group; ##, p < 0.01 compared with CL-infected group; NS, non-significant, using one-way ANOVA with Tukey's post hoc test. (n = 4–10 mice per group).
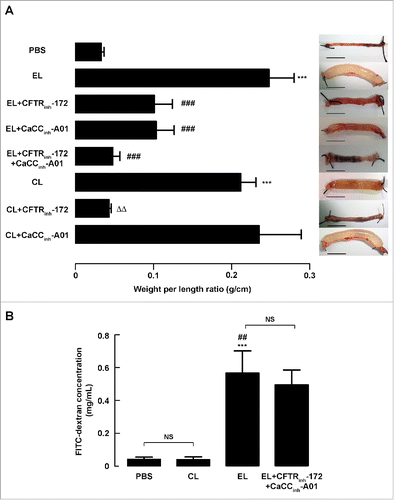
Figure 1. Roles of CFTR and CaCC in EL-induced intestinal fluid secretion and the effect of EL infection on intestinal barrier disruption. (A) Contribution of CFTR and CaCC to EL-induced intestinal fluid secretion. Ileal loops were inoculated with EL or CL (105 CFU/loop) with or without intraperitoneal administration of CFTRinh-172, CaCCinh-A01 or CFTRinh-172 plus CaCCinh-A01. At 12 h after bacterial challenge, ileal loops were removed for measurements of loop weight/length ratio. Data are expressed as means of weight/length ratio ± SEM ***, p < 0.001 compared with PBS-instilled group; ###, p < 0.001 compared with EL-infected group; ΔΔ, p < 0.01 compared with CL-infected group using one-way ANOVA with Tukey's post hoc test (n = 4–9 mice per group). (B) Effect of EL infection on intestinal barrier function. At 12 h after inoculation with EL with or without CFTRinh-172 plus CaCCinh-A01 or CL, FITC-dextran flux assays were performed. Data are expressed as means of FITC-dextran concentrations ± SEM. ***, p < 0.001 compared with PBS-instilled group; ##, p < 0.01 compared with CL-infected group; NS, non-significant, using one-way ANOVA with Tukey's post hoc test. (n = 4–10 mice per group).

Figure 2. Effect of EL infection on the inflammatory response in mouse intestine. (A) Effect of EL on nuclear translocation of phosphorylated NF-κB. Expressions of phosphorylated NF-κB (p65) in cytosolic fractions and nuclear fractions were analyzed using western blot analysis. Data are expressed as the mean of relative band intensity ± SEM. NS, non-significant; **, p < 0.01; ***, p < 0.001 compared with PBS-instilled group; #, p < 0.05 compared with CL-infected group (n = 7 mice per group). β-actin and Lamin B1 were used as loading controls of cytosolic fraction and nuclear fraction, respectively. (B) Relative mRNA expression of proinflammatory cytokines analyzed by real-time quantitative PCR. Results are normalized to GAPDH mRNA levels. Data are expressed as fold changes over control ± SEM. NS, non-significant; **, p < 0.01; ***, p < 0.001 compared with PBS-instilled group; #, p < 0.05 compared with CL-infected group (n = 4–10 samples per group). (C) Protein expressions of iNOS and COX-2 analyzed by protein gel blot analysis. Data are expressed as the mean of relative band intensity ± SEM. NS, non-significant; **, p < 0.01 compared with PBS-instilled group; #, p < 0.05 compared with CL-infected group (n = 4–6 mice per group). Statistical analysis was performed using one-way ANOVA with Tukey's post hoc test.
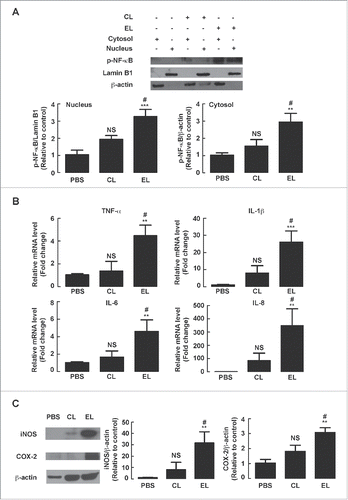
Figure 2. Effect of EL infection on the inflammatory response in mouse intestine. (A) Effect of EL on nuclear translocation of phosphorylated NF-κB. Expressions of phosphorylated NF-κB (p65) in cytosolic fractions and nuclear fractions were analyzed using western blot analysis. Data are expressed as the mean of relative band intensity ± SEM. NS, non-significant; **, p < 0.01; ***, p < 0.001 compared with PBS-instilled group; #, p < 0.05 compared with CL-infected group (n = 7 mice per group). β-actin and Lamin B1 were used as loading controls of cytosolic fraction and nuclear fraction, respectively. (B) Relative mRNA expression of proinflammatory cytokines analyzed by real-time quantitative PCR. Results are normalized to GAPDH mRNA levels. Data are expressed as fold changes over control ± SEM. NS, non-significant; **, p < 0.01; ***, p < 0.001 compared with PBS-instilled group; #, p < 0.05 compared with CL-infected group (n = 4–10 samples per group). (C) Protein expressions of iNOS and COX-2 analyzed by protein gel blot analysis. Data are expressed as the mean of relative band intensity ± SEM. NS, non-significant; **, p < 0.01 compared with PBS-instilled group; #, p < 0.05 compared with CL-infected group (n = 4–6 mice per group). Statistical analysis was performed using one-way ANOVA with Tukey's post hoc test.
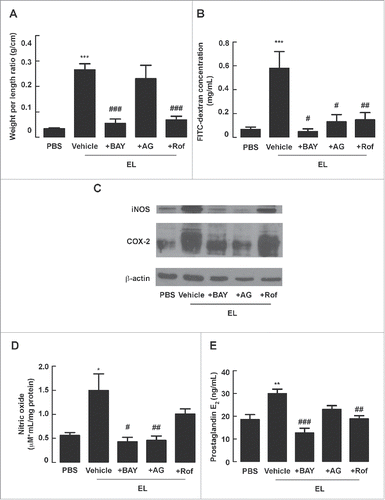
Figure 3. Role of NF-κB-mediated iNOS and COX-2 expression in EL-induced fluid secretion and barrier disruption in mouse intestine. Mouse ileal loops were inoculated with EL with or without intraperitoneal administration of NF-κB inhibitor BAY 11-7082 (BAY), iNOS inhibitor aminoguanidine (AG), or COX-2 inhibitor rofecoxib (Rof). At 12 h post-inoculation, ileal loops were removed for measurements of loop weight/length ratio and biochemical assays, or subjected to measurements of FITC-dextran flux. (A) Intestinal fluid secretion measured from loop weight/length ratio. Data are expressed as means of weight/length ratio ± SEM ***, p< 0.001 compared with PBS-instilled group; ###, p < 0.001 compared with EL-infected control group (n = 4–9 mice per group). (B) Intestinal barrier function measured by FITC-dextran flux. Data are expressed as means of FITC-dextran concentrations ± SEM ***, p < 0.001 compared with PBS-instilled group; #, p < 0.05; ##, p < 0.01 compared with EL-infected control group (n = 4–10 mice per group). (C) Protein expressions of iNOS and COX-2 analyzed by western blot analysis. A representative immunoblot of 5 mice is shown. (D) Measurements of NO in mouse intestinal tissues using Griess test. Data are expressed as means of NO concentrations ± SEM *, p < 0.05 compared with PBS-instilled group; #, p < 0.05; ##, p < 0.01 compared with EL-infected control group (n = 5–8 mice per group). (E) Measurements of PGE2 in mouse intestinal tissues using ELISA. Data are expressed as means of PGE2 concentrations ± SEM **, p < 0.01 compared with PBS-instilled group; ##, p < 0.01; ###, p < 0.001 compared with EL-infected control group (n = 3–5 mice per group). Statistical analysis was performed using one-way ANOVA with Tukey's post hoc test.

Figure 3. Role of NF-κB-mediated iNOS and COX-2 expression in EL-induced fluid secretion and barrier disruption in mouse intestine. Mouse ileal loops were inoculated with EL with or without intraperitoneal administration of NF-κB inhibitor BAY 11-7082 (BAY), iNOS inhibitor aminoguanidine (AG), or COX-2 inhibitor rofecoxib (Rof). At 12 h post-inoculation, ileal loops were removed for measurements of loop weight/length ratio and biochemical assays, or subjected to measurements of FITC-dextran flux. (A) Intestinal fluid secretion measured from loop weight/length ratio. Data are expressed as means of weight/length ratio ± SEM ***, p< 0.001 compared with PBS-instilled group; ###, p < 0.001 compared with EL-infected control group (n = 4–9 mice per group). (B) Intestinal barrier function measured by FITC-dextran flux. Data are expressed as means of FITC-dextran concentrations ± SEM ***, p < 0.001 compared with PBS-instilled group; #, p < 0.05; ##, p < 0.01 compared with EL-infected control group (n = 4–10 mice per group). (C) Protein expressions of iNOS and COX-2 analyzed by western blot analysis. A representative immunoblot of 5 mice is shown. (D) Measurements of NO in mouse intestinal tissues using Griess test. Data are expressed as means of NO concentrations ± SEM *, p < 0.05 compared with PBS-instilled group; #, p < 0.05; ##, p < 0.01 compared with EL-infected control group (n = 5–8 mice per group). (E) Measurements of PGE2 in mouse intestinal tissues using ELISA. Data are expressed as means of PGE2 concentrations ± SEM **, p < 0.01 compared with PBS-instilled group; ##, p < 0.01; ###, p < 0.001 compared with EL-infected control group (n = 3–5 mice per group). Statistical analysis was performed using one-way ANOVA with Tukey's post hoc test.

Figure 4. Histological and ultrastructural analyses of mouse intestine following EL infection. Mouse ileal loops were inoculated with EL with or without intraperitoneal administration of NF-κB inhibitor BAY 11-7082 (BAY), iNOS inhibitor aminoguanidine (AG), or COX-2 inhibitor rofecoxib (Rof). At 12 h post-inoculation, ileal loops were removed for histological and ultrastructural examinations. (A) Representative images of hematoxylin and eosin-stained tissues (upper panel, 40X; lower panel, 80X). Green arrow indicates dilated lacteal pattern. Orange asterisk indicates extended submucosa. Blue arrow indicates congested blood vessels. (n = 4 mice per group) (B) Representative images acquired from transmission electron microscope. Red arrow indicates irregular tight junctions. Black arrow indicates normal structure of tight junction (n = 4 mice per group)
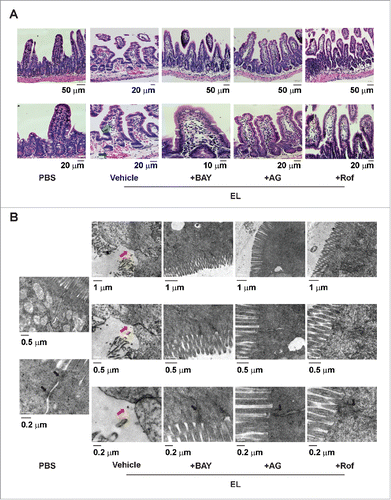
Figure 4. Histological and ultrastructural analyses of mouse intestine following EL infection. Mouse ileal loops were inoculated with EL with or without intraperitoneal administration of NF-κB inhibitor BAY 11-7082 (BAY), iNOS inhibitor aminoguanidine (AG), or COX-2 inhibitor rofecoxib (Rof). At 12 h post-inoculation, ileal loops were removed for histological and ultrastructural examinations. (A) Representative images of hematoxylin and eosin-stained tissues (upper panel, 40X; lower panel, 80X). Green arrow indicates dilated lacteal pattern. Orange asterisk indicates extended submucosa. Blue arrow indicates congested blood vessels. (n = 4 mice per group) (B) Representative images acquired from transmission electron microscope. Red arrow indicates irregular tight junctions. Black arrow indicates normal structure of tight junction (n = 4 mice per group)

Figure 5. Involvement of EP2 and EP4 receptors of PGE2 in mediating intestinal fluid secretion and crosstalk to calcium signaling during EL infection. Mouse ileal loops were inoculated with EL with or without intraperitoneal administration of EP2 PGE2 antagonist AH-6809 or EP4 PGE2 antagonist L-161982. At 12 h post-inoculation, ileal loops were removed for measurements of loop weight/length ratio or protein gel blot analysis. (A) Intestinal fluid secretion measured from loop weight/length ratio. Data are expressed as means of weight/length ratio ± SEM ***, p < 0.001 compared with PBS-instilled group; ###, p < 0.001 compared with EL-infected control group (n = 5–8 mice per group). (B) Effect on CaMKII phosphorylation. Western blot analysis of lysates of mouse intestinal tissues was performed using antibodies against phosphorylated CaMKII (p-CaMKII). Data are expressed as means of relative band intensity ± SEM **, p < 0.01 compared with PBS-instilled group; ###, p < 0.001 compared with EL-infected control group (n = 3–4 mice per group). Statistical analysis was performed using one-way ANOVA with Tukey's post hoc test.
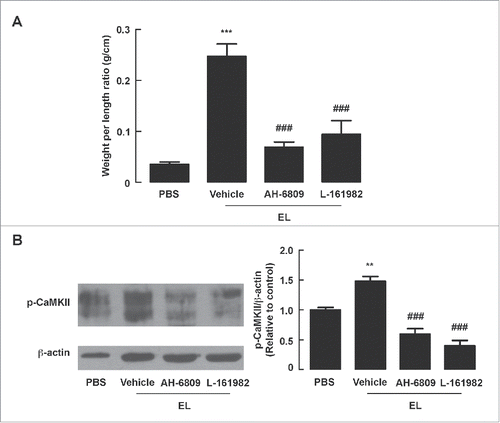
Figure 5. Involvement of EP2 and EP4 receptors of PGE2 in mediating intestinal fluid secretion and crosstalk to calcium signaling during EL infection. Mouse ileal loops were inoculated with EL with or without intraperitoneal administration of EP2 PGE2 antagonist AH-6809 or EP4 PGE2 antagonist L-161982. At 12 h post-inoculation, ileal loops were removed for measurements of loop weight/length ratio or protein gel blot analysis. (A) Intestinal fluid secretion measured from loop weight/length ratio. Data are expressed as means of weight/length ratio ± SEM ***, p < 0.001 compared with PBS-instilled group; ###, p < 0.001 compared with EL-infected control group (n = 5–8 mice per group). (B) Effect on CaMKII phosphorylation. Western blot analysis of lysates of mouse intestinal tissues was performed using antibodies against phosphorylated CaMKII (p-CaMKII). Data are expressed as means of relative band intensity ± SEM **, p < 0.01 compared with PBS-instilled group; ###, p < 0.001 compared with EL-infected control group (n = 3–4 mice per group). Statistical analysis was performed using one-way ANOVA with Tukey's post hoc test.
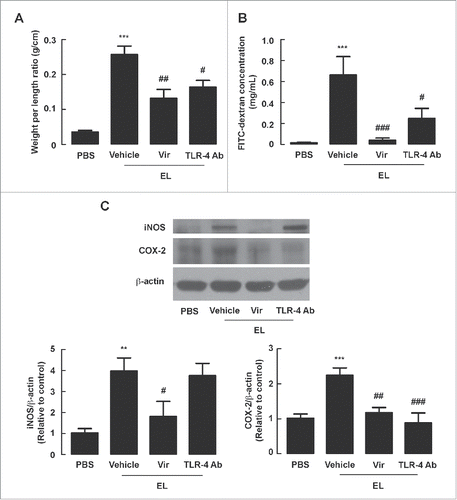
Figure 6. Role of CT expression and TLR-4 in mediating EL-induced fluid secretion and barrier disruption in mouse intestine. Mouse ileal loops were inoculated with EL with or without virstatin (inhibitor of CT expression) or TLR-4 antibodies. At 12 h post-inoculation, ileal loops were removed for measurements of loop weight/length ratio or western blot analysis, or subjected to FITC-dextran flux assays. (A) Intestinal fluid secretion measured from loop weight/length ratio. Data are expressed as means of weight/length ratio ± SEM ***, p< 0.001 compared with PBS-instilled group; #, p < 0.05; ##, p < 0.01 compared with EL-infected control group (n = 5–8 mice per group). (B) Intestinal barrier function measured by FITC-dextran flux assays. Data are expressed as means of FITC-dextran concentrations ± SEM ***, p < 0.001 compared with PBS-instilled group; #, p < 0.05; ###, p < 0.001 compared with EL-infected control group (n = 4–7 mice per group). (C) iNOS and COX-2 expressions analyzed by protein gel blotting. Data are expressed as means of relative band intensity ± SEM **, p < 0.01; ***, p < 0.001 compared with PBS-instilled group; #, p < 0.05; ##, p < 0.01; ###, p < 0.001 compared with EL-infected control group (n = 4–6 mice per group). Statistical analysis was performed using one-way ANOVA with Tukey's post hoc test.
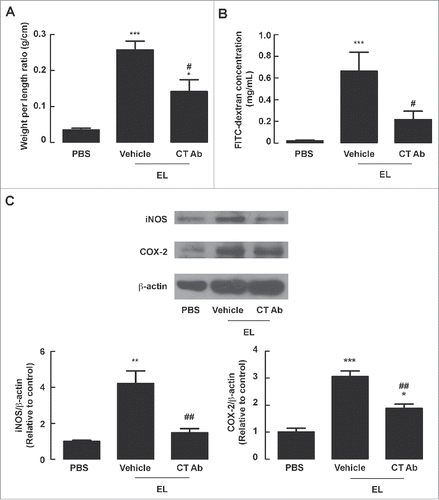
Figure 6. Role of CT expression and TLR-4 in mediating EL-induced fluid secretion and barrier disruption in mouse intestine. Mouse ileal loops were inoculated with EL with or without virstatin (inhibitor of CT expression) or TLR-4 antibodies. At 12 h post-inoculation, ileal loops were removed for measurements of loop weight/length ratio or western blot analysis, or subjected to FITC-dextran flux assays. (A) Intestinal fluid secretion measured from loop weight/length ratio. Data are expressed as means of weight/length ratio ± SEM ***, p< 0.001 compared with PBS-instilled group; #, p < 0.05; ##, p < 0.01 compared with EL-infected control group (n = 5–8 mice per group). (B) Intestinal barrier function measured by FITC-dextran flux assays. Data are expressed as means of FITC-dextran concentrations ± SEM ***, p < 0.001 compared with PBS-instilled group; #, p < 0.05; ###, p < 0.001 compared with EL-infected control group (n = 4–7 mice per group). (C) iNOS and COX-2 expressions analyzed by protein gel blotting. Data are expressed as means of relative band intensity ± SEM **, p < 0.01; ***, p < 0.001 compared with PBS-instilled group; #, p < 0.05; ##, p < 0.01; ###, p < 0.001 compared with EL-infected control group (n = 4–6 mice per group). Statistical analysis was performed using one-way ANOVA with Tukey's post hoc test.
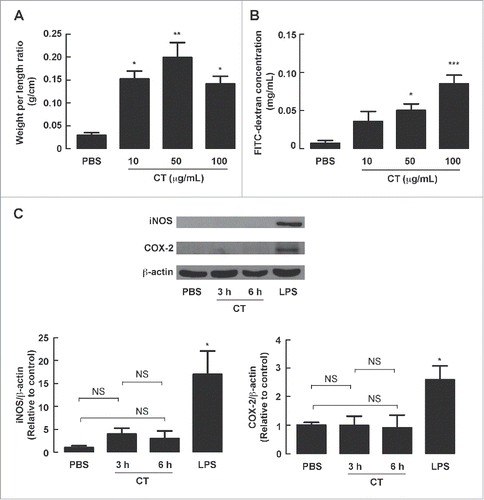
Figure 7. Attenuation of EL-induced fluid secretion, barrier disruption and expression of iNOS and COX-2 in mouse intestine through CT neutralization. Mouse ileal loops were inoculated with EL with or without CT antibodies (CT Ab). At 12 h post-inoculation, ileal loops were removed for measurements of loop weight/length ratio or western blot analysis, or subjected to FITC-dextran flux assays. (A) Intestinal fluid secretion measured from loop weight/length ratio. Data are expressed as means of weight/length ratio ± SEM *, p < 0.05; ***, p < 0.001 compared with PBS-instilled group; #, p < 0.05 compared with EL-infected control group (n = 5–8 mice per group). (B) Intestinal barrier integrity measured by FITC-dextran flux assays. Data are expressed as means of FITC-dextran concentrations ± SEM ***, p < 0.001 compared with PBS-instilled group; #, p < 0.05 compared with EL-infected control group (n = 4–7 mice per group). (C) Expressions of iNOS and COX-2 analyzed by protein gel blotting. Data are expressed as means of relative band intensity ± SEM *, P < 0.05, **, p < 0.01; ***, p < 0.001 compared with PBS-instilled group; ##, p < 0.01 compared with EL-infected control group (n = 3–5 mice per group). Statistical analysis was performed using one-way ANOVA with Tukey's post hoc test.

Figure 7. Attenuation of EL-induced fluid secretion, barrier disruption and expression of iNOS and COX-2 in mouse intestine through CT neutralization. Mouse ileal loops were inoculated with EL with or without CT antibodies (CT Ab). At 12 h post-inoculation, ileal loops were removed for measurements of loop weight/length ratio or western blot analysis, or subjected to FITC-dextran flux assays. (A) Intestinal fluid secretion measured from loop weight/length ratio. Data are expressed as means of weight/length ratio ± SEM *, p < 0.05; ***, p < 0.001 compared with PBS-instilled group; #, p < 0.05 compared with EL-infected control group (n = 5–8 mice per group). (B) Intestinal barrier integrity measured by FITC-dextran flux assays. Data are expressed as means of FITC-dextran concentrations ± SEM ***, p < 0.001 compared with PBS-instilled group; #, p < 0.05 compared with EL-infected control group (n = 4–7 mice per group). (C) Expressions of iNOS and COX-2 analyzed by protein gel blotting. Data are expressed as means of relative band intensity ± SEM *, P < 0.05, **, p < 0.01; ***, p < 0.001 compared with PBS-instilled group; ##, p < 0.01 compared with EL-infected control group (n = 3–5 mice per group). Statistical analysis was performed using one-way ANOVA with Tukey's post hoc test.

Figure 8. Effect of purified CT on intestinal fluid secretion, barrier disruption and expression of iNOS and COX-2 in mouse intestine. Mouse ileal loops were instilled with PBS or PBS containing 10 μg/mL, 50 μg/mL or 100 μg/mL of CT. At 12 h post-treatment, ileal loops were removed for (A) measurements of loop weight/length ratio and (B) FITC-dextran flux assays. Data are expressed as means ± SEM *, p< 0.05; **, p < 0.01; ***, p < 0.001 compared with PBS-instilled group (n = 4 mice per group). (C) Effect of CT on expression of iNOS and COX-2. Mouse ileal loops were instilled with PBS with or without CT (50 μg/mL). Three or 6 hours later, ileal loops were removed for measurements of iNOS and COX-2 expression using western blot analysis. A representative immunoblot is shown. LPS (0.4 mg/mL, 6-h exposure) was used as a positive control. Data are expressed as means of relative band intensity ± SEM. NS, non-significant; *, p < 0.05 compared with PBS-instilled group (n = 4 mice per group). Statistical analysis was performed using one-way ANOVA with Tukey's post hoc test.

Figure 8. Effect of purified CT on intestinal fluid secretion, barrier disruption and expression of iNOS and COX-2 in mouse intestine. Mouse ileal loops were instilled with PBS or PBS containing 10 μg/mL, 50 μg/mL or 100 μg/mL of CT. At 12 h post-treatment, ileal loops were removed for (A) measurements of loop weight/length ratio and (B) FITC-dextran flux assays. Data are expressed as means ± SEM *, p< 0.05; **, p < 0.01; ***, p < 0.001 compared with PBS-instilled group (n = 4 mice per group). (C) Effect of CT on expression of iNOS and COX-2. Mouse ileal loops were instilled with PBS with or without CT (50 μg/mL). Three or 6 hours later, ileal loops were removed for measurements of iNOS and COX-2 expression using western blot analysis. A representative immunoblot is shown. LPS (0.4 mg/mL, 6-h exposure) was used as a positive control. Data are expressed as means of relative band intensity ± SEM. NS, non-significant; *, p < 0.05 compared with PBS-instilled group (n = 4 mice per group). Statistical analysis was performed using one-way ANOVA with Tukey's post hoc test.

Figure 9. Illustration of pathophysiological mechanisms of EL-induced intestinal fluid secretion and intestinal barrier disruption in mice. (1) EL produces CT, which induces intestinal barrier disruption. (2) LPS derived from EL translocates to the serosal side of intestinal epithelial cells (IEC) and binds to TLR-4 in both IEC and immune cells. (3) NF-κB activation leads to COX-2 expression and increased PGE2 production. (4) PGE2 binds to EP2 and EP4 receptors on IEC, resulting in generation of intracellular cAMP. (5) Intracellular cAMP elevation together with crosstalk to the Ca2+-dependent signaling pathway induces intestinal Cl- secretion via CFTR and CaCC, and causes intestinal barrier disruption. In addition, NO derived from NF-κB-mediated iNOS expression is involved in EL-induced intestinal barrier disruption.
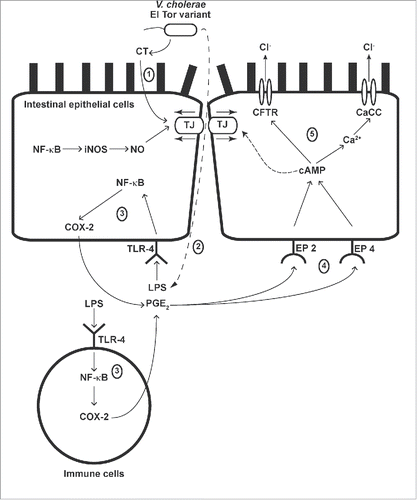
Figure 9. Illustration of pathophysiological mechanisms of EL-induced intestinal fluid secretion and intestinal barrier disruption in mice. (1) EL produces CT, which induces intestinal barrier disruption. (2) LPS derived from EL translocates to the serosal side of intestinal epithelial cells (IEC) and binds to TLR-4 in both IEC and immune cells. (3) NF-κB activation leads to COX-2 expression and increased PGE2 production. (4) PGE2 binds to EP2 and EP4 receptors on IEC, resulting in generation of intracellular cAMP. (5) Intracellular cAMP elevation together with crosstalk to the Ca2+-dependent signaling pathway induces intestinal Cl- secretion via CFTR and CaCC, and causes intestinal barrier disruption. In addition, NO derived from NF-κB-mediated iNOS expression is involved in EL-induced intestinal barrier disruption.

Table 1. Primer sequences used for mRNA expression analysis by quantitative real-time PCR.

Supplemental material

KVIR_S_1192743.docx

Download MS Word (545.5 KB)

Reprints and Corporate Permissions

Please note: Selecting permissions does not provide access to the full text of the article, please see our help page How do I view content?

To request a reprint or corporate permissions for this article, please click on the relevant link below:

Academic Permissions

Please note: Selecting permissions does not provide access to the full text of the article, please see our help page How do I view content?

Obtain permissions instantly via Rightslink by clicking on the button below:

If you are unable to obtain permissions via Rightslink, please complete and submit this Permissions form. For more information, please visit our Permissions help page.