1,705
Views
13
CrossRef citations to date
0
Altmetric
Research Paper

Antibodies to Staphylococcus aureus capsular polysaccharides 5 and 8 perform similarly in vitro but are functionally distinct in vivo

, , , &
Pages 859-874 | Received 08 Aug 2016, Accepted 02 Dec 2016, Published online: 17 Jan 2017

Figures & data

Table 1. Monoclonal antibodies isolated from mice immunized with CP5 or CP8 conjugate vaccines.

Figure 1. Reactivity of five mAbs with native and O-deacetylated CP5 and CP8. (A) Structural similarities between CP5 and CP8 and their sites of O-acetylation (O-Ac). Both CP5-specific mAbs (4C2 and 5D1) reacted with (B) native CP5, whereas only mAb 4C2 reacted with (C) O-deacetylated CP5 (De-O-CP5). Three CP8-specific mAbs (5A6, 3B5, and 4G5) reacted with (D) native CP8, whereas only 5A6 and 3B5 reacted with (E) O-deacetylated (De-O-CP8) CP8. D-ManNAcA, N-acetyl-D-mannosaminuronic acid; L-FucNAc, N-acetyl-L-fucosamine; D-FucNAc, N-acetyl-D-fucosamine. Each sample was tested in duplicate, and the ELISAs were performed at least twice. The mean values of a representative experiment are shown.
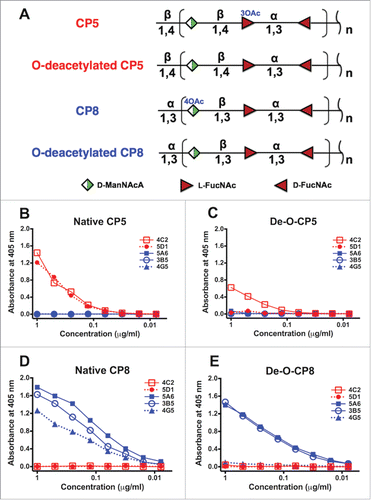
Figure 1. Reactivity of five mAbs with native and O-deacetylated CP5 and CP8. (A) Structural similarities between CP5 and CP8 and their sites of O-acetylation (O-Ac). Both CP5-specific mAbs (4C2 and 5D1) reacted with (B) native CP5, whereas only mAb 4C2 reacted with (C) O-deacetylated CP5 (De-O-CP5). Three CP8-specific mAbs (5A6, 3B5, and 4G5) reacted with (D) native CP8, whereas only 5A6 and 3B5 reacted with (E) O-deacetylated (De-O-CP8) CP8. D-ManNAcA, N-acetyl-D-mannosaminuronic acid; L-FucNAc, N-acetyl-L-fucosamine; D-FucNAc, N-acetyl-D-fucosamine. Each sample was tested in duplicate, and the ELISAs were performed at least twice. The mean values of a representative experiment are shown.

Table 2. Strains used in this study or tested in the colony immunoblot.

Figure 2. mAbs CP5–4C2 and CP8–5A6 were tested by colony immunoblot for reactivity with S. aureus type 5 and 8 reference strains or clinical isolates. The staphylococcal isolates are listed in . mAb 4C2 reacted with all 14 serotype 5 isolates, whereas mAb 5A6 reacted with 19 of 21 serotype 8 isolates. CoNS, coagulase-negative staphylococci; CP-, capsule negative. The immunoblot was performed three times, and a representative blot is shown.
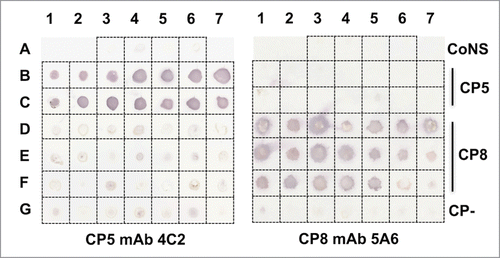
Figure 2. mAbs CP5–4C2 and CP8–5A6 were tested by colony immunoblot for reactivity with S. aureus type 5 and 8 reference strains or clinical isolates. The staphylococcal isolates are listed in Table 2. mAb 4C2 reacted with all 14 serotype 5 isolates, whereas mAb 5A6 reacted with 19 of 21 serotype 8 isolates. CoNS, coagulase-negative staphylococci; CP-, capsule negative. The immunoblot was performed three times, and a representative blot is shown.

Figure 3. Opsonic activity of CP5-specific mAbs (A) 4C2 and (B) 5D1 against wild type strain Reynolds (CP5) and its isogenic cap5H deletion mutant that produces wild-type levels of O-deacetylated CP5. The mAbs were serially diluted 3-fold and tested in the OPK assay. The results are expressed as percent changes in the number of CFU/ml after a 2-h incubation with mAb, HL60 cells, and a complement (C’) source. The samples labeled SA+ C’+HL60 contain no mAb. The titer is expressed as the lowest mAb dilution that killed 50% of the inoculum (dotted line). The experiment was performed twice, and a representative experiment is shown.
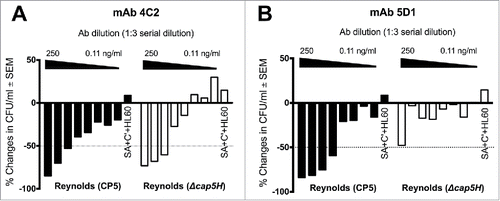
Figure 3. Opsonic activity of CP5-specific mAbs (A) 4C2 and (B) 5D1 against wild type strain Reynolds (CP5) and its isogenic cap5H deletion mutant that produces wild-type levels of O-deacetylated CP5. The mAbs were serially diluted 3-fold and tested in the OPK assay. The results are expressed as percent changes in the number of CFU/ml after a 2-h incubation with mAb, HL60 cells, and a complement (C’) source. The samples labeled SA+ C’+HL60 contain no mAb. The titer is expressed as the lowest mAb dilution that killed 50% of the inoculum (dotted line). The experiment was performed twice, and a representative experiment is shown.

Figure 4. Comparative opsonic activity of mAbs against serotype 5 and 8 S. aureus strains. (A) Backbone-specific CP5 mAb 4C2 showed somewhat better opsonic activity against Reynolds (CP5) than strain Newman. (B) Backbone-specific CP8 mAbs 5A6 showed comparable opsonic activity against Reynolds (CP8) and MRSA strain ST80–16. (C) O-acetyl-specific CP8 mAb 4G5 showed greater OPK activity against Reynolds (CP8) than strain ST80–16. The sample labeled 0 antibody contained HL60s, S. aureus, and the complement source. The data shown are means ( ± standard errors) of three to four experiments.
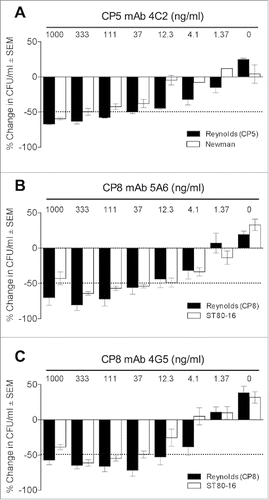
Figure 4. Comparative opsonic activity of mAbs against serotype 5 and 8 S. aureus strains. (A) Backbone-specific CP5 mAb 4C2 showed somewhat better opsonic activity against Reynolds (CP5) than strain Newman. (B) Backbone-specific CP8 mAbs 5A6 showed comparable opsonic activity against Reynolds (CP8) and MRSA strain ST80–16. (C) O-acetyl-specific CP8 mAb 4G5 showed greater OPK activity against Reynolds (CP8) than strain ST80–16. The sample labeled 0 antibody contained HL60s, S. aureus, and the complement source. The data shown are means ( ± standard errors) of three to four experiments.

Figure 5. Passive immunization with CP5- or CP8-specific mAbs in the mouse bacteremia model. Mice were immunized IV with 100 µg of (A) CP5 mAb 4C2 or (B) CP8 mAb 5A6 24 h before challenge by the IP route with 107 CFU (A) S. aureus Reynolds (CP5) or (B) Reynolds (CP8). Control mice were immunized with irrelevant mAb 6C5 or polyclonal CP5 specific rabbit IgG (300 µg), and all mice were bled 2 h after bacterial challenge. The horizontal lines represent median CFU/ml blood for each group of mice. Bacteremia levels in mice administered mAbs 4C2 or 5A6 were compared by the Mann-Whitney U test to levels in control mice given mAb 6C5. ****, P < 0.0001; ***, P < 0.001; **, P < 0.01.
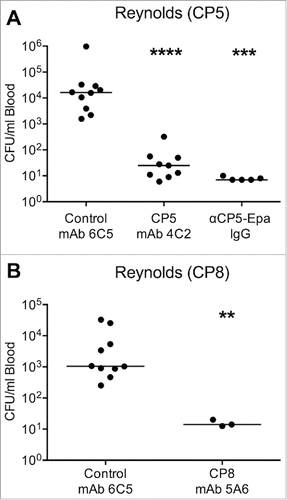
Figure 5. Passive immunization with CP5- or CP8-specific mAbs in the mouse bacteremia model. Mice were immunized IV with 100 µg of (A) CP5 mAb 4C2 or (B) CP8 mAb 5A6 24 h before challenge by the IP route with 107 CFU (A) S. aureus Reynolds (CP5) or (B) Reynolds (CP8). Control mice were immunized with irrelevant mAb 6C5 or polyclonal CP5 specific rabbit IgG (300 µg), and all mice were bled 2 h after bacterial challenge. The horizontal lines represent median CFU/ml blood for each group of mice. Bacteremia levels in mice administered mAbs 4C2 or 5A6 were compared by the Mann-Whitney U test to levels in control mice given mAb 6C5. ****, P < 0.0001; ***, P < 0.001; **, P < 0.01.

Figure 6. Passive immunization with polyclonal anti-CP8 antibodies in the mouse bacteremia model. Mice were immunized with 1 mg anti-CP8-Epa or anti-Shigella 2a-Epa IgG 24 h before challenge with 107 CFU (A) S. aureus Reynolds (CP8) or (B, C) two different inocula (low inoculum 7 × 10⁷ CFU/mouse or high inoculum 1 × 10⁸ CFU/mouse) of strain ST80–16. Mice challenged with Reynolds (CP8) were bled 2 h after bacterial challenge, and mice challenged with ST80–16 were bled 1.5 h after bacterial challenge. The horizontal lines represent median CFU/ml blood for each group of mice. Bacteremia levels in mice given CP8-Epa IgG were compared by the Mann-Whitney U test to levels in control mice given 2a-Epa IgG. ***, P < 0.001.
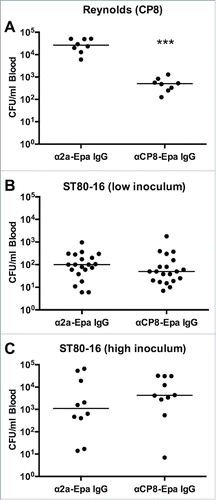
Figure 6. Passive immunization with polyclonal anti-CP8 antibodies in the mouse bacteremia model. Mice were immunized with 1 mg anti-CP8-Epa or anti-Shigella 2a-Epa IgG 24 h before challenge with 107 CFU (A) S. aureus Reynolds (CP8) or (B, C) two different inocula (low inoculum 7 × 10⁷ CFU/mouse or high inoculum 1 × 10⁸ CFU/mouse) of strain ST80–16. Mice challenged with Reynolds (CP8) were bled 2 h after bacterial challenge, and mice challenged with ST80–16 were bled 1.5 h after bacterial challenge. The horizontal lines represent median CFU/ml blood for each group of mice. Bacteremia levels in mice given CP8-Epa IgG were compared by the Mann-Whitney U test to levels in control mice given 2a-Epa IgG. ***, P < 0.001.

Figure 7. Quantitation of cell-associated and soluble CP5 or CP8 produced by clinical isolates of S. aureus cultivated in RMPI + 1% casamino acids. CP levels were measured by an ELISA inhibition method, and CP5 and CP8 concentrations are expressed relative to those of Reynolds (CP5) and Reynolds (CP8), respectively, which were included as reference strains on every assay. CP levels were compared by one-way ANOVA, and multiple comparisons were made to the reference strains Reynolds (CP5) and Reynolds (CP8). ***, P < 0.001; **, P < 0.01; *, P < 0.05.
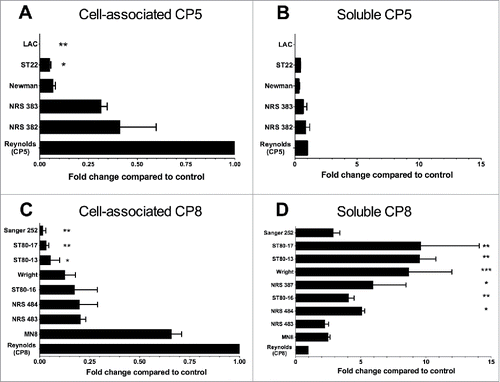
Figure 7. Quantitation of cell-associated and soluble CP5 or CP8 produced by clinical isolates of S. aureus cultivated in RMPI + 1% casamino acids. CP levels were measured by an ELISA inhibition method, and CP5 and CP8 concentrations are expressed relative to those of Reynolds (CP5) and Reynolds (CP8), respectively, which were included as reference strains on every assay. CP levels were compared by one-way ANOVA, and multiple comparisons were made to the reference strains Reynolds (CP5) and Reynolds (CP8). ***, P < 0.001; **, P < 0.01; *, P < 0.05.

Figure 8. Plasma levels of CP5 or CP8 in mice infected IV with ∼2 × 10⁸ CFU of S. aureus NRS382 (CP5+) or ST80–17 (CP8+), respectively. After 1 to 5 days, the animals were bled by cardiac stick, and the plasma extracts were prepared. CP levels were determined by an ELISA inhibition assay, and CP concentrations were compared by the Mann-Whitney U test. *, P < 0.05. The lower limit of CP detection is indicated by a dashed line.
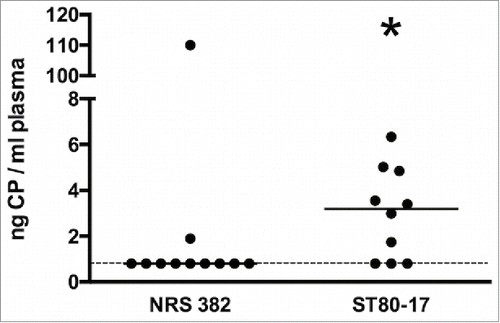
Figure 8. Plasma levels of CP5 or CP8 in mice infected IV with ∼2 × 10⁸ CFU of S. aureus NRS382 (CP5+) or ST80–17 (CP8+), respectively. After 1 to 5 days, the animals were bled by cardiac stick, and the plasma extracts were prepared. CP levels were determined by an ELISA inhibition assay, and CP concentrations were compared by the Mann-Whitney U test. *, P < 0.05. The lower limit of CP detection is indicated by a dashed line.
Supplemental material

KVIR_S_1270494.zip

Download Zip (1 MB)

Reprints and Corporate Permissions

Please note: Selecting permissions does not provide access to the full text of the article, please see our help page How do I view content?

To request a reprint or corporate permissions for this article, please click on the relevant link below:

Academic Permissions

Please note: Selecting permissions does not provide access to the full text of the article, please see our help page How do I view content?

Obtain permissions instantly via Rightslink by clicking on the button below:

If you are unable to obtain permissions via Rightslink, please complete and submit this Permissions form. For more information, please visit our Permissions help page.