Figures & data
Figure 1. (a) The relative and cumulative inertia of the first 35 axes from a COA of the RSCU values; (b) PCA of different genotypes. Green, blue, red and orange refer to PCV3a-1, PCV3a-2, PCV3a-IM and PCV3b, respectively.
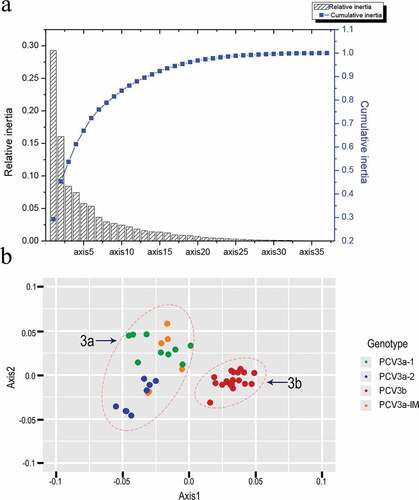
Figure 2. ENC values of PCV3 and the different genotypes. Green, blue, red and orange represented PCV3a-1, PCV3a-2, PCV3a-IM and PCV3b, respectively.
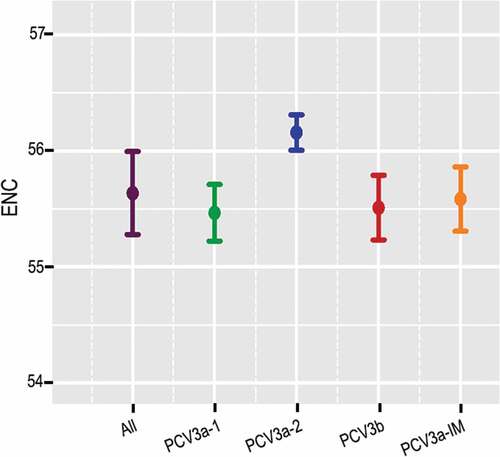
Table 1. RSCU analysis of PCV3 genotypes and potential hosts.
Table 2. Correlation analysis among codon composition, ENC value, nucleic acid composition, Gravy, Aroma and axis 1, axis2.
Figure 3. ENC-plot analysis (ENC plotted against GC3s). The black curve represents the expected curve derived from the positions of strains when the codon usage was only determined by the GC3s composition. PCV3a-1, PCV3a-2, PCV3a-IM and PCV3b are represented in green, blue, red and orange, respectively.
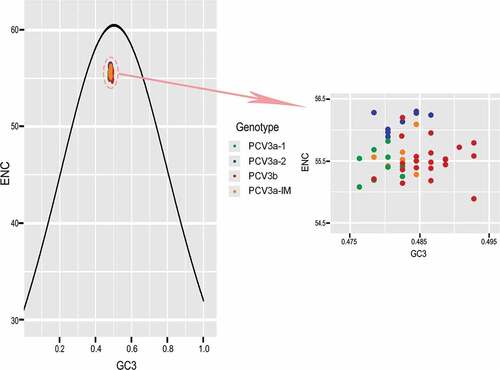
Figure 4. PR2 analysis of PCV3 and specific genes. Red, green and blue refer to complete coding sequences, ORF1 and ORF2, respectively.
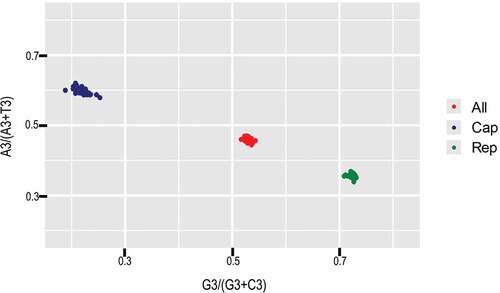
Figure 5. Neutrality plot analysis (GC12s plotted against GC3s) for all the coding sequences of PCV3 and the different genotypes.
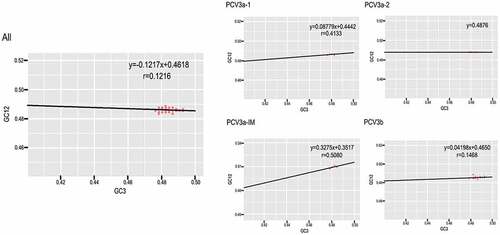
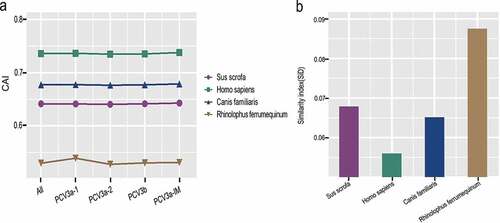
Figure 6. (a) CAI and (b) SiD analysis of different genotypes of PCV3 coding sequences in relation to potential host species, including Sus scrofa (purple), Homo sapiens (green), Canis familiaris (blue) and Rhinclophus ferrumequinum (brown).