1,360
Views
7
CrossRef citations to date
0
Altmetric
Letter to the Editor

Efficient infection of hamster with Leishmania donovani by retro-orbital inoculation

, , , & ORCID Icon
Pages 711-718 | Received 03 Dec 2018, Accepted 23 Jul 2019, Published online: 07 Aug 2019

Figures & data

Figure 1. Live weight gain of experimental hamsters along the experimental infection with 108 stationary phase promastigotes of Leishmania donovani (MHOM/SD/43/124). (○): uninfected control animals; (■): hamsters inoculated by the retro-orbital route; (▼): animals infected by intraperitoneal inoculation; (△): animal group infected by via intracardiac injection. Values are means ± standard error of the mean (SEM).
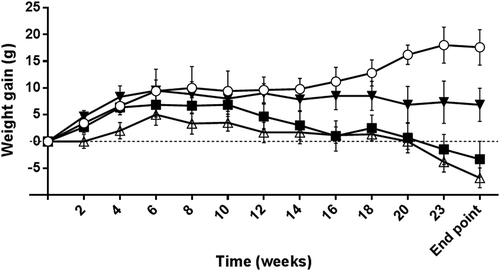
Figure 1. Live weight gain of experimental hamsters along the experimental infection with 108 stationary phase promastigotes of Leishmania donovani (MHOM/SD/43/124). (○): uninfected control animals; (■): hamsters inoculated by the retro-orbital route; (▼): animals infected by intraperitoneal inoculation; (△): animal group infected by via intracardiac injection. Values are means ± standard error of the mean (SEM).

Figure 2. Peripheral serum antibody response of hamsters inoculated with L.donovani by retro-orbital (RO), intracardiac (IC) and intraperitoneal (IP) routes along the experimental period estimated by ELISA. (a) Serum IgG response. (b) Serum IgG2 response. (○) uninfected, (■) RO, (▼) IP, and (△) IC. (c) Comparison of serum IgG, IgG1 and IgG2 levels of experimental groups of hamsters inoculated by different routes at the end point of the experiment. Values are mean ± SEM. **P < 0.01 and ****P < 0.0001: significant differences. Cut off was established at 0.167 for IgG, 0.027 for IgG1 and 0.049 for IgG2.
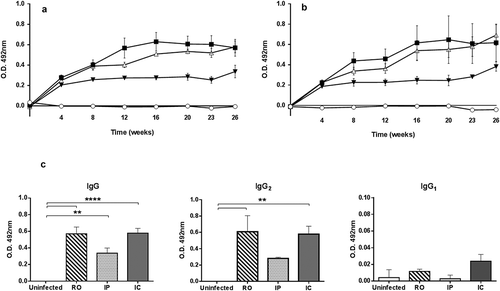
Figure 2. Peripheral serum antibody response of hamsters inoculated with L.donovani by retro-orbital (RO), intracardiac (IC) and intraperitoneal (IP) routes along the experimental period estimated by ELISA. (a) Serum IgG response. (b) Serum IgG2 response. (○) uninfected, (■) RO, (▼) IP, and (△) IC. (c) Comparison of serum IgG, IgG1 and IgG2 levels of experimental groups of hamsters inoculated by different routes at the end point of the experiment. Values are mean ± SEM. **P < 0.01 and ****P < 0.0001: significant differences. Cut off was established at 0.167 for IgG, 0.027 for IgG1 and 0.049 for IgG2.

Table 1. Spleen and liver weight of experimental animals (mean±SEM) at the end point of the experiment.

Figure 3. Spleen (a) and liver (b) relative weight to the total live weight of experimental hamsters inoculated with L.donovani by different routes. Abbreviations as in . Values are means ± SEM. *P < 0.05: significant differences.

Figure 3. Spleen (a) and liver (b) relative weight to the total live weight of experimental hamsters inoculated with L.donovani by different routes. Abbreviations as in Figure 2. Values are means ± SEM. *P < 0.05: significant differences.

Figure 4. Levels (mean±SEM) of hepatic and liver functionality markers of hamsters inoculated with L.donovani by different routes at the end point of the experiment. (a) alanine aminotransferase (ALT); (b) aspartate aminotransferase (AST); (c) AST/ALT; (d) alkaline phosphatase (ALP); (e) creatinine; (f): urea. *P < 0.05; **P < 0.01: significant differences.
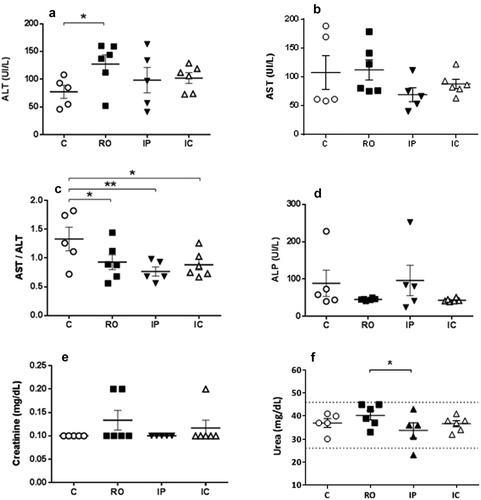
Figure 4. Levels (mean±SEM) of hepatic and liver functionality markers of hamsters inoculated with L.donovani by different routes at the end point of the experiment. (a) alanine aminotransferase (ALT); (b) aspartate aminotransferase (AST); (c) AST/ALT; (d) alkaline phosphatase (ALP); (e) creatinine; (f): urea. *P < 0.05; **P < 0.01: significant differences.

Table 2. Leishmania parasite burden (PB, parasites/gram) (Mean ± SEM) in spleen and liver estimated by Limiting Dilution Assay (LDA) at the end of the experiment.

Figure 5. Normalized L.donovani parasite burden (log) of spleen (a) and liver (b) of hamsters inoculated by different routes. Both individual and mean±SEM values are given. (■) RO, (▼) IP, and (△) IC. *P < 0.05: significant differences.

Figure 5. Normalized L.donovani parasite burden (log) of spleen (a) and liver (b) of hamsters inoculated by different routes. Both individual and mean±SEM values are given. (■) RO, (▼) IP, and (△) IC. *P < 0.05: significant differences.