
Figures & data
Figure 1. Enrichment analysis and expression profiles of differentially expressed genes (DEGs). (a) Functional map for downregulated DEGs enriched for GO terms. (b) Statistical analysis of the top 30 enriched KEGG pathways during PEDV infection. The x-axis indicates the factor of enrichment, whereas the y-axis indicates the KEGG channel. The dot color indicates the q value. The dot size corresponds to the number of DEGs mapped to the reference category. (c and d) Hierarchical clustering of extracellular matrix-constituent (c) and -regulated (d) DEGs. Rows indicate hierarchical clustering in accordance with average linkage based on Pearson correlation coefficients with the measured distance. Expression was visualized using a gradient color scheme; the scale from the minimal to maximal abundance fell in the range of −3.0 to 3.0. Blue represents low expression, whereas red represents high expression. (e) The total protein collected from the small intestine of PEDV-infected piglets (48 h post-infection) was prepared, and the expression levels of ECM-associated proteins (i.e., COL4A1, LAMB2, ITG6, and DCN) and PEDV N protein were determined by western blotting. The data shown are means ± SDs from triplicate experiments. *P < 0.05, **P < 0.01
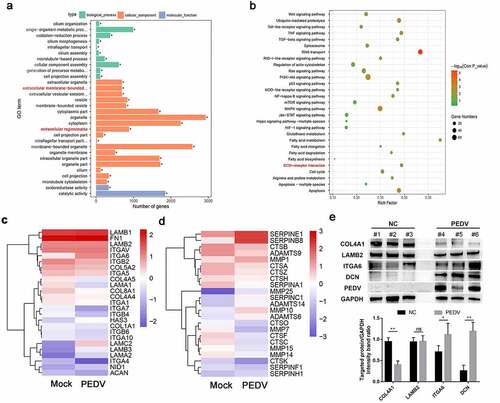
Figure 2. Protein-protein interaction (PPI) network analysis and evaluation of the relationships between the DEGs and ECM receptor signaling. (a) A PPI network of DEGs was constructed using STRING and visualized using Cytoscape. The hub genes in the bar chart were identified based on the connectivity degree within the PPI. DEGs are represented as round nodes. Green and red nodes indicate downregulated and upregulated DEGs, respectively. Proteins with mutual associations show edge-based connections, and combined interaction scores are indicated by the edge thickness. (b) The mRNA levels of hub genes in Vero E6 cells and intestinal tissues infected with PEDV were quantified using RT-qPCR. (c) Correlation analysis between the expression of hub genes in Vero E6 cells and intestinal tissues infected with PEDV. The color of the dots indicates positive or negative correlations, and the dot size indicates the correlation coefficient (r); Pearson and Spearman correlation analyses were employed for determining the r value. Data are presented as means ± SDs of three independent experiments. *P < 0.05, **P < 0.01
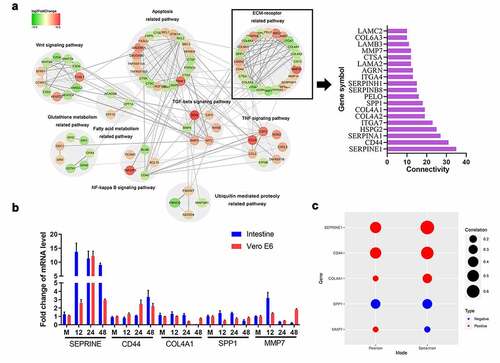
Figure 3. Infection with PEDV enhanced CD44 and PAI-1 protein levels. Vero E6 cells were mock-infected or PEDV-infected (MOI = 0.1) at the time indicated (1–48 h), then cellular total proteins were harvested. (a) CD44 and PAI-1 protein levels in Vero E6 cells were determined by western blotting. GAPDH was taken as the internal reference; the ratio of each protein gray value to that of GAPDH was regarded as the relative expression of protein. (b) Total protein was isolated from the intestinal tissues of PEDV-infected piglets (48 hpi), and CD44, PAI-1, and PEDV protein levels in the duodenum, jejunum, and ileum were detected by western blotting. (c and d) Staining for PAI-1 (d), CD44 (c), and PEDV antigen (N protein) based on immunofluorescence in the jejunum of PEDV-infected piglets. Red, CD44 or PAI-1; green, PEDV; blue, DAPI. Scale bars, 25 μm. The data shown represent means ± SDs from triplicate experiments. *P < 0.05, **P < 0.01
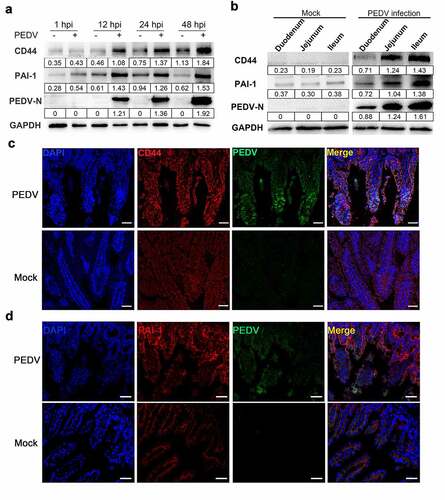
Figure 4. CD44 impeded PEDV infection. (a) CD44 knockdown verification. Cells were transfected with three shRNAs targeting CD44, and the silencing efficiency was verified by western blotting. Subsequently, Vero E6 cells stably transfected with shRNA-CD44#2 were established and inoculated with PEDV for 24 h. (b) PEDV protein levels in CD44-silenced cells were detected by western blotting. (c) Virus titers in the supernatants of cultures of CD44-silenced cells were detected by plaque assays. (d) Staining for PEDV antigen (N protein) in mock-transfected cells and CD44-silenced cells was evaluated by immunofluorescence. Green, PEDV; blue, DAPI. Bars, 50 μm. (e) Increased CD44 expression inhibited PEDV infection. Vero E6 cells were transfected with lentiviral particles to generate CD44-overexpressing cells and then infected with PEDV for 24 h. Western blotting was performed to determine the expression levels of CD44 and PEDV N proteins. (f) Vero E6 cells were transfected with a CD44 expression vector (pLVX-CD44) and infected with PEDV for 24 h. The extracellular virus titers were measured using plaque assays. The data represent means ± SDs of triplicate assays. * P < 0.05; ** P < 0.01
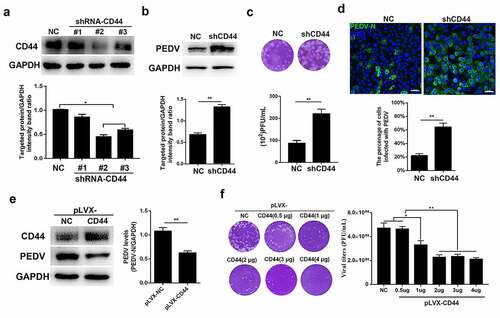
Figure 5. CD44 upregulated antiviral cytokines by activating NF-κB signaling. (a) CD44 knockdown blocked the secretion of antiviral cytokines following PEDV infection. CD44-knockdown and mock-transfected Vero E6 cells were infected with PEDV (MOI = 0.1) for 24 h, and IL-18, IL-11, and BD-1 mRNA levels were quantified by RT-qPCR. (b) CD44 overexpression enhanced antiviral cytokine secretion. IL-18, IL-11, and BD-1 mRNA levels were detected in CD44-overexpressing Vero E6 cells. (c) CD44 induced the phosphorylation of NF-κB in Vero E6 cells. Cells were infected with PEDV (MOI = 0.1) for 24 h, and CD44, p65, phospho-p65, PEDV (N protein), and GAPDH (loading control) protein levels in CD44-knockdown and -overexpressing cells were detected by western blotting. Statistical results for p65 and phospho-p65 are shown in bar charts. (d) CD44-knockdown cells were infected with PEDV, and the nuclear translocation of p65 was verified by IFA. Colors correspond to nuclei (blue) and p65 (red). Scale bars, 25 μm. Nuclear accumulation of p65 was evaluated in 200 cells in three independent experiments; the data are shown in bar charts. (e–g) To inhibit NF-κB activation, CD44-overexpressing Vero E6 cells were treated with BAY 11–7082 (10 μM) or DMSO for 2 h at 37°C. After washing, cells were infected with PEDV (MOI = 0.1) for 24 h and harvested for subsequent analyses. (e) The protein levels of CD44, p65, phospho-p65, PEDV (N protein), and GAPDH were detected by western blotting. Statistical results for CD44, p65, phospho-p65, and PEDV are presented in bar charts. (f) virus titers were detected by plaque assays. (g) IL-18, IL-11, and DB-1 mRNA levels were further determined. The data indicate means ± SDs of triplicate assays. * P < 0.05; ** P < 0.01
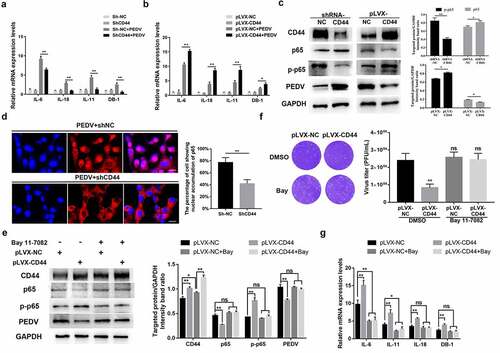
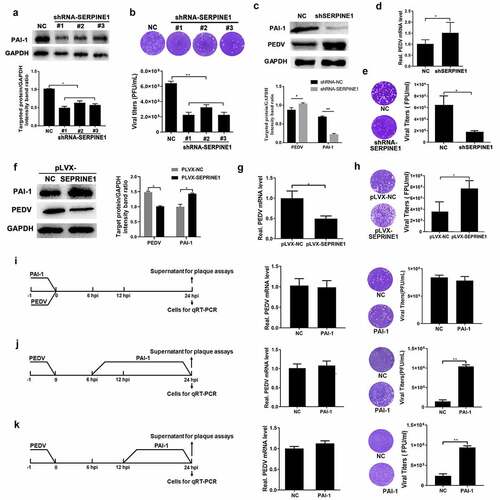
Figure 6. PAI-1 promoted PEDV release. (a) PAI-1 knockdown verification. Cells were infected with lentivirus particles expressing shRNAs targeting SERPINE1. After 48 h, western blotting was performed to investigate SERPINE1 knockdown efficiency. (b) Following PEDV infection (MOI = 0.1), extracellular virus titers were evaluated using plaque tests. (c–e) SERPINE1-knockdown cell lines were established by puromycin screening, and greater than 80% interference efficiency was achieved. (c) SERPINE1-knockdown cell lines were infected with PEDV (MOI = 0.1) for 24 h, and PEDV N expression was evaluated by western blotting. (d) Viral RNA expression was evaluated by RT-qPCR. (e) Extracellular virus titers were measured using plaque assays. (f) PAI-1-overexpressing cell lines were infected with PEDV (MOI = 0.1) for 24 h, and western blotting was performed to investigate PAI-1 and PEDV N expression. (g) Viral RNA expression was quantified by RT-qPCR. (h) The yield of the progeny virus was measured using plaque assays. Extracellular PAI-1 affected the replication stage of PEDV infection. PAI-1 (160 ng/mL) was added to the medium at the entry (−1 h to 0 h of inoculation) (i), prebudding (6–24 hpi) (j), or release (12–24 hpi) (k) stages of PEDV infection (MOI = 0.1). Intracellular viral RNA and extracellular virus titers were detected at 24 h after PEDV inoculation. The data represent means ± SDs of triplicate assays. * P < 0.05; ** P < 0.01
Supplemental Material
Download MS Word (1.8 MB)Data availability
The authors declare that all data supporting the findings of this study are available in the manuscript and its Supplementary Information files or are available from the corresponding author upon request.