
Figures & data
Figure 1. Set1 has little effect on overall gene expression although it is required for virulence of C. albicans. A, mouse survival analysis. the 6-week-old female BALB/c mice are injected intravenously with 0.1 ml of 107 ml−1 cells. five mice were used for each strain. The Δset1 strain has attenuated virulence in mice as reported by Dr Clancy group [Citation15]. black closed circles, WT (SC5314, clinical isolated); Gray closed squares, Δset1. B, heatmap of total mRNA expression in WT and Δset1. Raw RNA-seq data were normalized by library size using DESeq2 and transformed into a log10 scale. the values were clustered and visualized using Pheatmap R Package. C, Venn diagram of top 50% genes with the highest expression levels. Top 50% expressed genes (3,097 genes in WT) were classified into three groups. Only 30 genes downregulated significantly in Δset1 (adjusted p value < 0.05)
![Figure 1. Set1 has little effect on overall gene expression although it is required for virulence of C. albicans. A, mouse survival analysis. the 6-week-old female BALB/c mice are injected intravenously with 0.1 ml of 107 ml−1 cells. five mice were used for each strain. The Δset1 strain has attenuated virulence in mice as reported by Dr Clancy group [Citation15]. black closed circles, WT (SC5314, clinical isolated); Gray closed squares, Δset1. B, heatmap of total mRNA expression in WT and Δset1. Raw RNA-seq data were normalized by library size using DESeq2 and transformed into a log10 scale. the values were clustered and visualized using Pheatmap R Package. C, Venn diagram of top 50% genes with the highest expression levels. Top 50% expressed genes (3,097 genes in WT) were classified into three groups. Only 30 genes downregulated significantly in Δset1 (adjusted p value < 0.05)](/cms/asset/b95f18f9-41e1-45c0-b98f-9f93fe647a62/kvir_a_1980988_f0001_oc.jpg)
Figure 2. Set1 is required for proper expression of mitochondria-related genes and oxidative stress response genes. A, Heatmap of 41 Set1-regulated genes. The 41 genes are significantly downregulated in Δset1 versus WT (adjusted p value < 0.05). Raw RNA-seq data were normalized by library size using DESeq2 and transformed into a log10 scale. The values were clustered and visualized as a heatmap using Pheatmap R Package. The mitochondrial genes are indicated in bold. B, RNA-seq data was visualized in Integrative Genomics Viewer (IGV) for 10 Set1-regulated genes related to mitochondria. ADH1 gene is used as control. The y-axis range varies depending on the gene expression levels for each gene
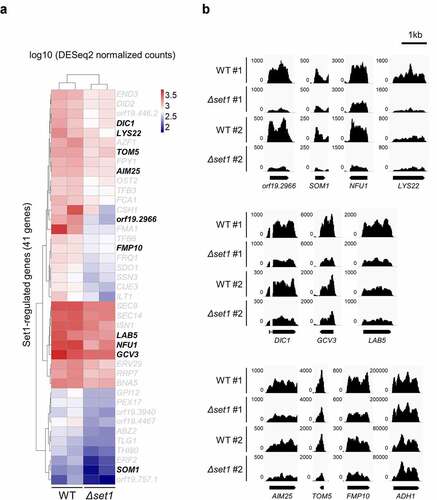
Figure 3. H3K4me3 is enriched in 5ʹ ORF of Set1-regulated genes. A, Western blot analysis of H3K4 methylation in S. cerevisiae (Sc) and C. albicans (Ca). FM391 is used as a WT control for S. cerevisiae Δset1. Set1 is the sole methyltransferase in C. albicans. Histone H3 is used as a loading control. B, H3K4me3 ChIP followed by qPCR was performed in WT and Δset1. The 5ʹ end sequences of Set1-regulated genes related to mitochondria were used as amplicon. Intergenic region (IGR) is used as a negative control. All ChIP analyses were performed in two independent biological replicates and qPCR was performed in triplicated. *p < 0.05 and **P < 0.01
Figure 4. Cellular ROS is more generated in Δset1. A, Cellular oxidative status analysis in WT and Δset1. Cells were harvested in the early exponential phase and permeabilized with zymolyase followed by staining with 5 mM CellROX® Green. Cellular ROS was detected by fluorescence microscopy. C, Comparative growth of WT and Δset1 on H2O2-containing media. Overnight cultured cells were diluted into 107 CFU ml−1. 3 μl of 5-fold serial diluted cells were spotting on YPD or YPD added 5 mM H2O2. Each experiment was repeated at the same condition
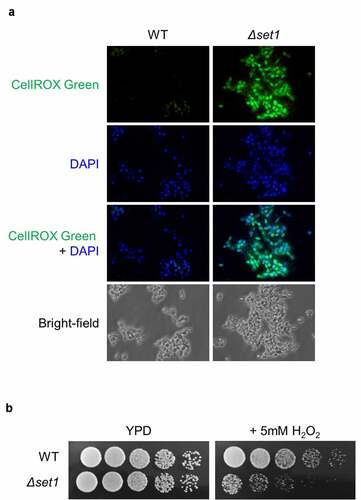
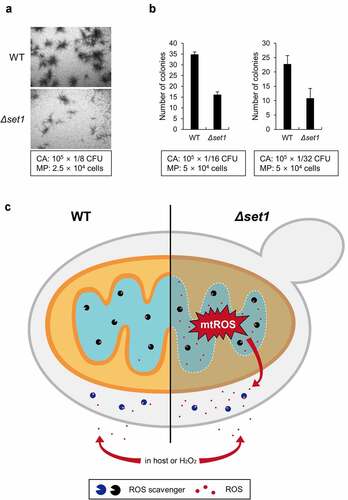
Figure 5. Δset1 has attenuated virulence because of mitochondrial ROS leakage. A, The colony formation of C. albicans in the presence of RAW264.7 murine macrophage cells after 24 h incubation. The used amount of C. albicans and macrophage cells was represented in box. The representative microscopic images are shown. CA, C. albicans; MP, macrophage. B, The number of colonies was counted in the indicated ratio between C. albicans and macrophages and represented the average form. C, Proposed model. In WT, naturally occurring cellular ROS was cleared by ROS scavengers, represented as packman. On the other hand, because the mitochondrial protein genes are not properly expressed in Δset1, the mitochondrial membrane becomes loose and generates more cellular mitochondrial ROS than WT. Since the amount of ROS scavenger is the same as WT, the ROS accumulated in the cell is continuously neutralized by the antioxidant enzymes. However, if they are attacked by macrophage or treated with external ROS, Δset1 is more susceptible to oxidative stress because of the already generated cellular ROS
Supplemental Material
Download (6 MB)Availability of data and materials
Sequencing data sets generated and/or analyzed during this study have been deposited to the Gene Expression Omnibus Database (GEO) under the accession number: GSE158481 (https://www.ncbi.nlm.nih.gov/geo/query/acc.cgi?acc=GSE158481). All data generated or analyzed during this study are included in this published article and its Additional files.