Figures & data
Figure 1. Crispr/Cas Proteins Are Secreted And Induce A Host Immune Response. (a) Western blotting of 30 d MTB H37Rv culture filtrates (50 μg protein) with anti-Csm sera (1 μg/ml). Control: GroEL (unsecreted protein; 50 μg). (b) Northern blotting of culture filtrates with an MTB CRISPR repeat (sense) probe. Control: cytoplasmic RNA. (c) Secreted CRISPR/Cas proteins may form an extracellular complex. Native gel Western blotting of culture filtrates (50 μg protein) with anti-Csm sera (1 μg/ml). (d) Stimulation of PBMCs from active TB patients with recombinant Csm1, Csm6 and Cas6 provokes IFN-γ release. Dot plot showing spot forming units (SFU) per 2.5 × 10⁵ PBMCs, as determined with ELISPOT assays. Horizontal lines: median SFUs per group. SFUs ≥6: positive (dotted line). All experiments in A-C were performed at least three times. Images presented are from representative experiments
Figure 2. Secreted MTBCas6 is an important virulence factor in MTB pathogenesis. (a) Bacterial loads in the lung (a) and spleen (b) of BALB/c mice intravenously infected with ~1 × 10⁵ CFU M. tuberculosis H37Rv, ΔcasT, Δcas6 or Δcsm5 at the times indicated post-infection. Error bars: SEM. Group size: n = 4. (b) (a) Necroscopy of the lung and spleen of BALB/c mice infected with ~1 × 10⁵ H37Rv, ΔcasT, Δcas6 or Δcsm5 at 56 and 160 d post-infection. (b) Spleen weight of mice at 160 d post-infection. (c) Pathology of the lung in BALB/c mice infected with wild-type M. tuberculosis (H37Rv), ΔcasT, Δcas6 or Δcsm5. H&E stained mouse lung tissue (50 × magnification, scale bar = 300 μm) at 14 d, and 160 d post-infection. Inset images (1000 × magnification, scale bar = 20 μm) show M. tuberculosis bacilli. Experiments in A were performed at least three times. Images presented in B and care from representative experiments
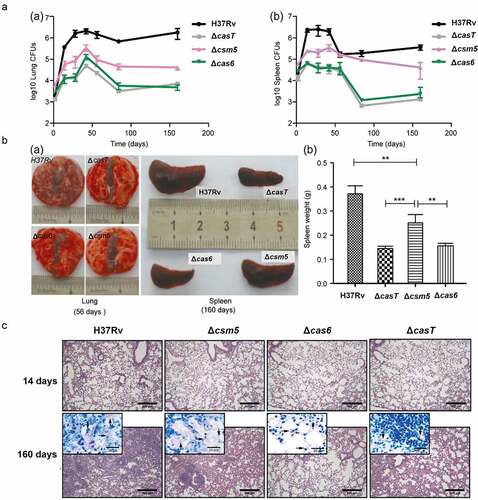
Figure 3. MTBCas6 induces macrophage and lung fibroblast apoptosis. (a) Dose–response curves of Cas6, Csm1 and Csm3 induction of THP-1 macrophage apoptosis. PMA-differentiated THP-1 cells were incubated with a range of concentrations of 6X His tagged- Csm1, Csm3 and Cas6, buffer, or 1 μM Heat-inactivated 6X His tagged-Csm1 (HI-Csm1), Csm3 (HI-Csm3) or Cas6 (HI-Cas6) (boiled for 1 h before addition to cells as a control for specificity) for 24 h. Apoptosis was detected by Annexin V/PI staining. (b-c) Raw264.7 cells (b) and L929 cells (c) were treated with 0.1 µM Cas6 for 24 h and apoptosis was detected by Annexin V/PI staining (a. untreated b. MBP protein c. Heat-inactivated MTBCas6 protein (HI-Cas6) d. MTBCas6 protein). Data presented are means ± SD from representative experiments with three independent biological replicates. **P < 0.01, Student’s t-test
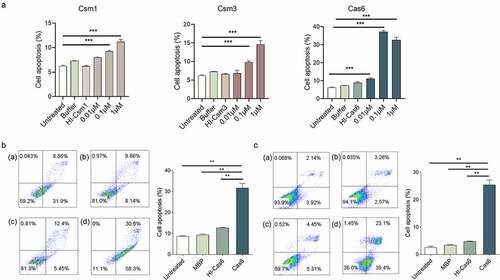
Figure 4. MTBCas6-induced apoptosis involves interactions with the cell surface. (a-b) MTBCas6-induced apoptosis is not a classical caspase-dependent pathway. Apoptosis was determined by Annexin V/PI double staining flow cytometry. (a) Apoptosis in THP-1 cells treated with Z-VAD-FMK (10 μM) then incubated with MTBCas6 (0.1 μM) for 24 h (a. untreated b. MTBCas6 protein c. Z-VAD-FMK d. Z-VAD-FMK + MTBCas6 protein). (b) THP-1 cells were incubated with Z-DEVD-FMK (20 μM), then treated with MTBCas6 (0.1 μM) for 24 h (a. untreated b. MtbCas6 protein c. Z-DEVD-FMK d. Z-DEVD-FMK + MTBCas6 protein). (c-d) MTBCas6 is mainly located at the surface of THP-1 cells. (c) THP-1 cells incubated with anti-histidine were stained with Alexa Fluor–conjugated secondary antibody and analyzed on a FACS Calibur (a. untreated b. his antibody with Alex 647 c. MTBCas6 d. MTBCas6 + his antibody with Alex 647). (d) THP-1 cells treated with histidine-tagged MTBCas6, stained with anti-histidine followed by Alexa Fluor 647-conjugated secondary antibody (red) and DAPI (blue) were viewed with a CytationTM 3 reader. Bar = 100 µm. (e) MTBCas6 induces apoptosis via direct interactions with a cell surface protein. THP-1 cells were pretreated with CytD (10 μM) and apoptosis was induced by incubation with MTBCas6 protein (0.1 μM) (a. untreated b. MTBCas6 protein c. CytD d. CytD + MTBCas6 protein). (f) MTBCas6 induction of apoptosis does not occur via Toll-Like Receptor-2 (TLR-2). THP-1 cells were first incubated with TLR-2 antibody (5 µg/ml) for 2 h, then treated with MTBCas6 (0.1 μM) for 24 h (a. untreated b. MTBCas6 protein c. TLR-2 antibody d. TLR-2 antibody with MTBCas6 protein). Data presented are the mean ± SD of representative experiments with three independent biological replicates, **P < 0.01, ***P < 0.001, ns = non-significant, student’s t-test
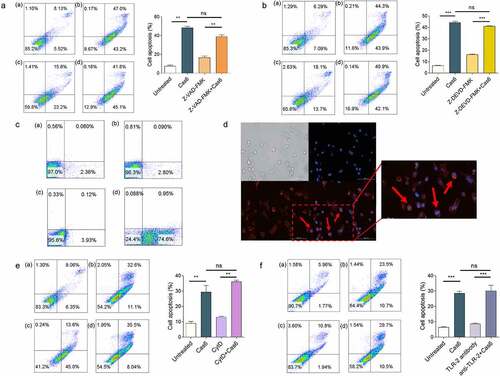
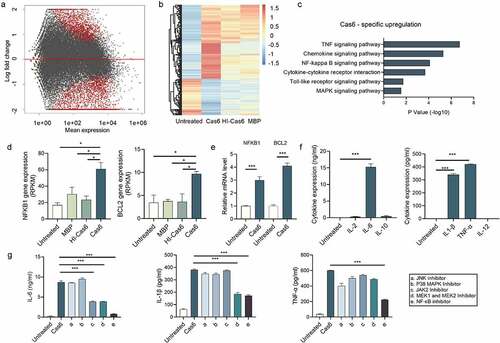
Figure 5. MTBCas6-induced release of IL-6, IL-1β and TNF-α from THP-1 cells is NF-κB-dependent. (a-b) THP-1 cells were treated with or without MTBCas6 (1 µg/ml), heat-inactivated MTBCas6 (HI-Cas6) (1 µg/ml) or MBP (1 µg/ml) for 24 h and total RNA was extracted and sequenced on an illumina HiSeqXten System. (a) MA-plot and (b) heat map of the 851 up-regulated and 767 down-regulated genes specific to the transcriptome of Cas6-THP-1 cells. (c) KEGG and GO gene functional annotation of MTBCas6-induced differentially expressed genes. (d) RNA-seq data for two highly differentially expressed genes associated with the NF-κB pathway. (e) Quantitative PCR analysis of NFKB1 and BCL2 expression in THP-1 cells treated with MTBCas6. (f) Levels of IL-1α, IL-1β, IL-6, IL-12, IL-2, IL-4, IL-10 and TNF-α in the supernatants of THP-1 cells treated with MTBCas6 (1 µg/ml) for 6 h as determined using ELISA assays. (g) IL-6, IL-1β, and TNF-α levels in supernatants from THP-1 cells stimulated with MTBCas6 (1 µg/ml) for 6 h together with NF-κB inhibitor CELASTROL (10 μM), JNK inhibitor SP600125 (10 μM), P38 MAPK Inhibitor SB203590 (10 μM), JAK2 Inhibitor AG490 (20 μM) or MEK1 and MEK2 Inhibitor PD98059 (10 μM). Data presented are means ± SD from representative experiments with three independent biological replicates, *P < 0.05, ***P < 0.001, student’s t-test