
Figures & data
Table 1. Bacterial strain characteristics and corresponding the MALDITet(X)-plus test results
Table 2. Characteristics of test strains used for test validation
Figure 1. Strategy for identification of Tet(x)-producers and non-Tet(X)-producing tetracycline-resistant strains and tetracycline-susceptible strains using the MALDITet(X)-plus test. Strains that showed peaks of tigecycline metabolite or oxytetracycline metabolite were labeled with “+”
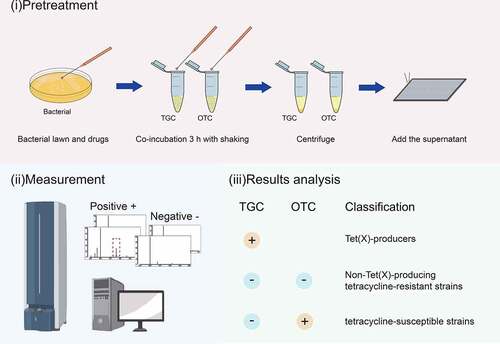
Figure 2. Representative MALDI-TOF MS results for detection of Tet(x)-producers and non-Tet(X)-producers. (a) Structures of TGC and OTC along with their oxygen-modified derivatives. (b) Representative MALDI-TOF MS spectra of tigecycline and oxytetracycline oxygenation assays after a 3 h incubation. Peaks of tigecycline and tigecycline metabolite are denoted by dashed red lines and represent peaks at m/z 586 ± 0.2 and m/z 602 ± 0.2, respectively. Peaks of oxytetracycline and oxytetracycline metabolite are denoted by dashed blue lines and represent peaks at m/z 460 ± 0.2 and m/z 476 ± 0.2, respectively
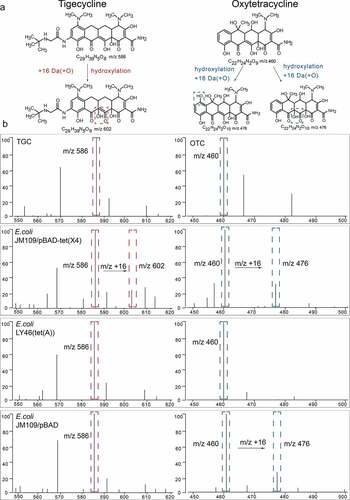
Figure 3. MALDITet(x)-plus test results using 319 test strains. (a) The cutoff value of 0.00405 can clearly distinguish Tet(X)-producers M/(M + T) >0.00405 (b) The cutoff value of 0.05945 can clearly identify non-Tet(X)-producers possessing M/(M + O) <0.05945. Three independent experiments were performed
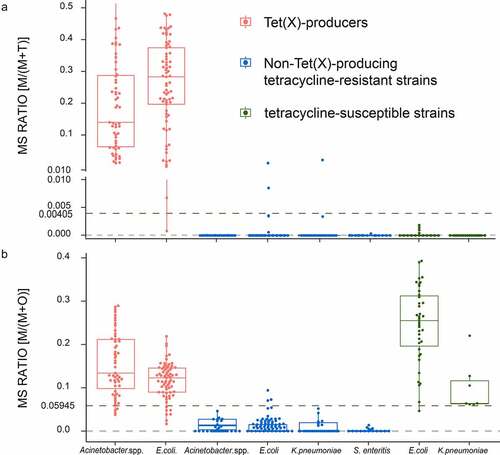
Figure 4. LC-MS/MS results for degradation of OTC by Tet(x)-producers, non-Tet(X) producers in tetracycline-resistant strains, and tetracycline-susceptible strains. The control group includes only OTC. We compare tetracycline-susceptible strains with Tet(X)-producers, non-Tet(X) producers in tetracycline-resistant strains, and the control group (three asterisk for p < 0.001)
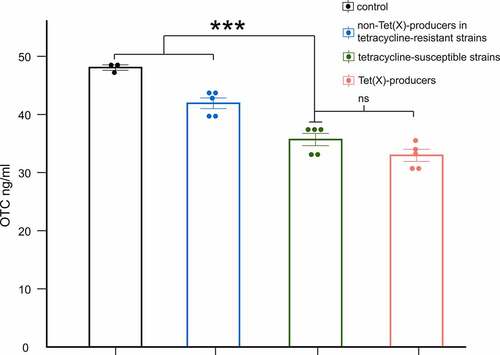
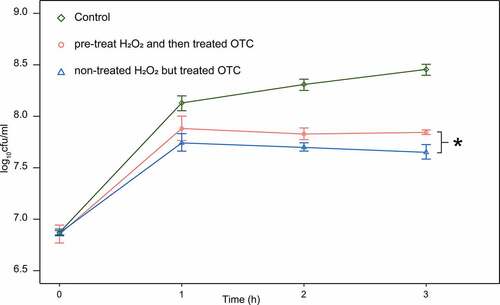
Figure5 Strain survival from 50 mg/L OTC, after pre-treated H2O2 for 30 min and compared with non-pre-treated strain (one asterisk for p < 0.05). control group grown in LB medium without H2O2 and OTC. Curves represent the mean of five independent cultures per time point
Supplemental Material
Download Zip (359 KB)Data availability statement
The authors confirm that the data supporting the findings of this study are available within the article and its supplementary materials.