
Figures & data
Figure 1. A schematic flow chart of the study protocol.
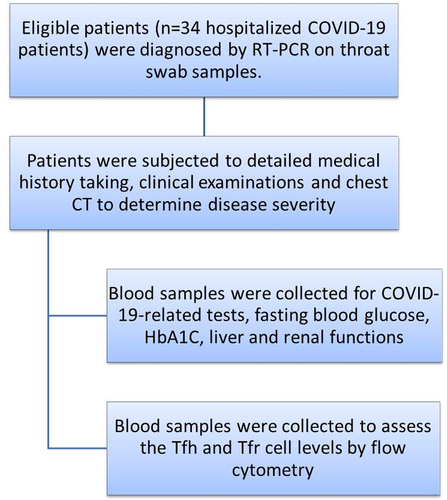
Figure 2. Flow cytometry gating strategy of follicular helper T cells (Tfh) and follicular regulatory T cells (Tfr) using FACSDiva software (Becton Dickinson Biosciences, USA).
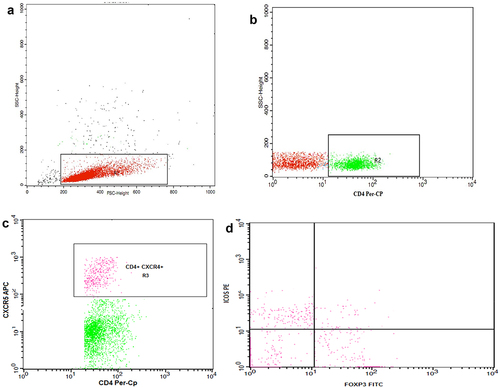
Table 1. Demographic, clinical and laboratory features of the COVID-19 patients
Figure 3. Comparison of the frequencies of follicular helper (Tfh) and follicular regulatory T (Tfr) cells between COVID-19 patients and controls (p-value*** <.0001, ** <.01, ns=not significant). Percentages of ICOS+ and ICOS- cells were calculated from CD4+CXCR5+ Tfh cells.
Figure 4. Comparison of the percentages of follicular helper (Tfh) and follicular regulatory T (Tfr) cells between severe and non-severe cases of COVID-19 (p-value: *** <.0001, ** <.01, ns=not significant). Percentages of ICOS+ and ICOS- cells were calculated from CD4+CXCR5+ Tfh cells.
Figure 5. A heat map showing the levels of activated Tfh cells (Cd4+cxcr5+icos+foxp3-), resting Tfh (Cd4+cxcr5+icos-Foxp3-), and Tfr cells (Cd4+cxcr5+icos+foxp3+) in relation with clinical and laboratory findings in COVID-19 patients. as shown, most of the CD4+CXCR5+ Tfh cells were activated (Icos+) in severe cases and the increase in its level was associated with higher LDH, D-dimer, and ferritin, as well as respiratory rate, and lower PaCo2. Resting Tfh and Tfr cells showed opposite relations with the laboratory indices of severity.
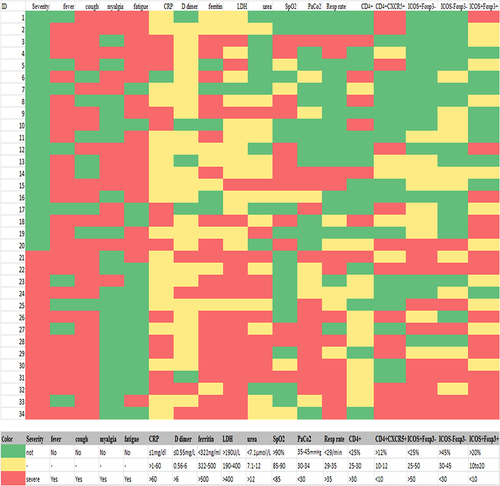
Figure 6. Comparison of the percentages of follicular helper (Tfh) and follicular regulatory T (Tfr) cells between diabetic and non-diabetic cases of COVID-19 and healthy controls (p-value: *** <.0001, ** <.01, ns=not significant). Percentages of ICOS+ and ICOS- cells were calculated from CD4+CXCR5+ Tfh cells.
Supplemental Material
Download MS Word (13.6 KB)Data availability statements
The datasets generated during and/or analyzed during the current study are available from the corresponding author on reasonable request after taking a permission from our ethical committee.