
Figures & data
Figure 1. Conservation and gene expression of the 24 TonB-dependent receptors encoded in the genome of strain OSU THCO2-90. (a) in silico prediction of TBDR encoding genes. The list of TBDR encoding genes was retrieved by in silico prediction of the plug and ß-barrel domains. Conservation in a selection of 22 isolates: gene present (blue), truncated (grey), absent (white). (a)MLST and genomic data are from Duchaud et al. [Citation42]. CC-ST: clonal complex-sequence type. (b)fish host: Oncorhynchus mykiss, Salmo trutta, Tinca tinca, Gasterosteus aculeatus, Plecoglossus altivelis, Oncorhynchus kitsutch, Salmo salar. (b) TBDR-encoding genes significantly upregulated (green) and down-regulated (red) in strain OSU THCO2-90 in iron-limited condition (TYES + 25 µM 2,2’-dipyridyl), under rainbow trout plasma exposure or in the presence of blood (TYES agar supplemented with 10% horse blood). Differential expression is expressed as log2-fold change values retrieved from Guérin et al. [Citation31] (https://fpeb.Migale.inrae.fr).
![Figure 1. Conservation and gene expression of the 24 TonB-dependent receptors encoded in the genome of strain OSU THCO2-90. (a) in silico prediction of TBDR encoding genes. The list of TBDR encoding genes was retrieved by in silico prediction of the plug and ß-barrel domains. Conservation in a selection of 22 isolates: gene present (blue), truncated (grey), absent (white). (a)MLST and genomic data are from Duchaud et al. [Citation42]. CC-ST: clonal complex-sequence type. (b)fish host: Oncorhynchus mykiss, Salmo trutta, Tinca tinca, Gasterosteus aculeatus, Plecoglossus altivelis, Oncorhynchus kitsutch, Salmo salar. (b) TBDR-encoding genes significantly upregulated (green) and down-regulated (red) in strain OSU THCO2-90 in iron-limited condition (TYES + 25 µM 2,2’-dipyridyl), under rainbow trout plasma exposure or in the presence of blood (TYES agar supplemented with 10% horse blood). Differential expression is expressed as log2-fold change values retrieved from Guérin et al. [Citation31] (https://fpeb.Migale.inrae.fr).](/cms/asset/44704dac-adff-4534-89b2-b856da632b1a/kvir_a_2101197_f0001_oc.jpg)
Figure 2. Transcriptional organization of the bfpR locus and its regulation by haemoglobin concentration. (a) genomic view of the bfpR locus, microarray expression profiles and putative transcription start sites (TSS) from Guérin et al. [Citation31]. Expression profiles (log2-expression signal) show the upregulation of bfpR in the presence of blood: bacterial colonies grown on TYES agar (TYESA) covered by 10% defibrinated horse blood (violet) or not (black). 3’-5’ RACE: schematic representation of 5’ and 3’ ends identified by circular 3’-5’ RACE experiments. Positions of the 5’ and 3’ ends are relative to the start and stop positions of bfpR CDS, respectively. (b) assessment of transcriptional initiation upstream of bfpR using transcriptional fusions. Promoter activity was measured using whole-cell fluorescence of F. psychrophilum cells carrying the reporter plasmid pCPGmr-Pless-mCh with various DNA fragments (Pless: empty plasmid; PbfpR_1: 306 bp, PbfpR_2: 609 bp, PbfpR_3: 950 bp). Bacterial colonies were grown on TYES agar supplemented with 1% haemoglobin (equivalent of 620 µm haem molecules) or not. Values represent the mean and standard deviation of three independent experiments. (*) indicates significant difference identified in a two-way ANOVA analysis (Bonferroni adjusted p-value < 0.05). (c) RT-qPCR measurement of bfpR expression. mRNA level was quantified using RNA extracted from cultures performed in TYES broth supplemented with 1% haemoglobin (Hb 1%) or not. Ct values of genes were normalized using the geomean of two reference genes (rpsA and frr). RQ: Relative quantification of mRNA was expressed as 2−∆∆Ct using TYES as reference sample. Values are the mean and standard deviation of three independent experiments.
![Figure 2. Transcriptional organization of the bfpR locus and its regulation by haemoglobin concentration. (a) genomic view of the bfpR locus, microarray expression profiles and putative transcription start sites (TSS) from Guérin et al. [Citation31]. Expression profiles (log2-expression signal) show the upregulation of bfpR in the presence of blood: bacterial colonies grown on TYES agar (TYESA) covered by 10% defibrinated horse blood (violet) or not (black). 3’-5’ RACE: schematic representation of 5’ and 3’ ends identified by circular 3’-5’ RACE experiments. Positions of the 5’ and 3’ ends are relative to the start and stop positions of bfpR CDS, respectively. (b) assessment of transcriptional initiation upstream of bfpR using transcriptional fusions. Promoter activity was measured using whole-cell fluorescence of F. psychrophilum cells carrying the reporter plasmid pCPGmr-Pless-mCh with various DNA fragments (Pless: empty plasmid; PbfpR_1: 306 bp, PbfpR_2: 609 bp, PbfpR_3: 950 bp). Bacterial colonies were grown on TYES agar supplemented with 1% haemoglobin (equivalent of 620 µm haem molecules) or not. Values represent the mean and standard deviation of three independent experiments. (*) indicates significant difference identified in a two-way ANOVA analysis (Bonferroni adjusted p-value < 0.05). (c) RT-qPCR measurement of bfpR expression. mRNA level was quantified using RNA extracted from cultures performed in TYES broth supplemented with 1% haemoglobin (Hb 1%) or not. Ct values of genes were normalized using the geomean of two reference genes (rpsA and frr). RQ: Relative quantification of mRNA was expressed as 2−∆∆Ct using TYES as reference sample. Values are the mean and standard deviation of three independent experiments.](/cms/asset/3d7924cf-5df8-49ca-87f2-6a817d10957b/kvir_a_2101197_f0002_oc.jpg)
Figure 3. bfpR is required for in vitro growth under high haemoglobin concentration. Growth under high haemoglobin concentration determined by viable cell measurements (CFU/ml) of cultures in TYES broth supplemented with 1% hemoglobin. Plain lines: wild-type (black) and deletion mutants (ΔbfpR: green; ΔhfpRΔbfpR: brown), dashed lines: ectopic complemented mutants. Values represent the mean and standard deviation of four independent experiments.
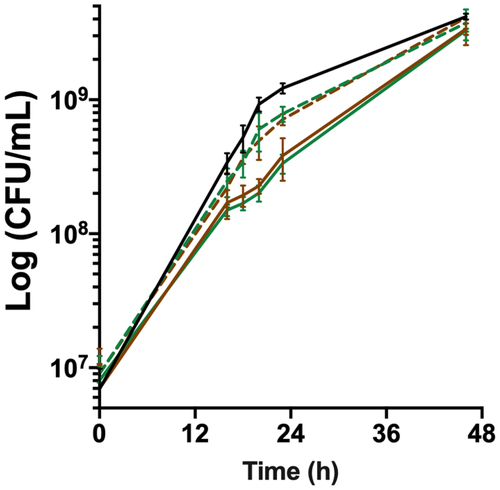
Figure 4. Transcriptional organization of the hfp locus and its regulation by iron availability. (a) genomic view of the hfpR-THC0290_1813-hfpY locus, microarray expression profiles and putative TSSs from Guérin et al. [Citation31] are shown (see legend of ). For iron limitation, cells were grown in TYES broth supplemented with 25 µM 2,2’-dipyridyl (red) or not (black); for blood supplementation, cells were from colonies grown on TYES agar (TYESA) covered by 10% defibrinated horse blood (violet) or not (black). 3’-5’ RACE: schematic representation of 5’ and 3’ ends identified by circular 3’-5’ RACE experiments. Positions of the two 5’ ends and of the 3’ end are relative respectively to start positions of hfpR, hfpY, and stop position of hfpY. (b) transcriptional regulation of the hfpR promoter by iron availability. Promoter activity was measured using whole-cell fluorescence of the wild-type strain carrying the reporter plasmid with 240 bp DNA upstream of hfpR (PhfpR). Bacteria were grown in iron depleted TYES broth (E20, 20 µM EDDHA) supplemented with a range of FeCl3 (upper panel) or with different iron sources (lower panel) as indicated. Cultures were inoculated at OD600 0.4 and fluorescence was measured during 5 h as described in materials and methods. Strain carrying the empty plasmid (Pless) was used as control. Values represent the mean and standard deviation of three independent experiments. (C) hfpR, 1813 and hfpY mRNA levels correlate with iron availability. RT-qPCR measurements were performed under iron depletion (upper panel) or high concentration of hemoglobin (lower panel) as described in using the wild-type strain grown in TYES broth, iron-depleted TYES (E20) supplemented with 1.25 µM haemoglobin (E20 Hb) or in TYES supplemented with 1% haemoglobin (Hb 1%).
![Figure 4. Transcriptional organization of the hfp locus and its regulation by iron availability. (a) genomic view of the hfpR-THC0290_1813-hfpY locus, microarray expression profiles and putative TSSs from Guérin et al. [Citation31] are shown (see legend of Figure 2). For iron limitation, cells were grown in TYES broth supplemented with 25 µM 2,2’-dipyridyl (red) or not (black); for blood supplementation, cells were from colonies grown on TYES agar (TYESA) covered by 10% defibrinated horse blood (violet) or not (black). 3’-5’ RACE: schematic representation of 5’ and 3’ ends identified by circular 3’-5’ RACE experiments. Positions of the two 5’ ends and of the 3’ end are relative respectively to start positions of hfpR, hfpY, and stop position of hfpY. (b) transcriptional regulation of the hfpR promoter by iron availability. Promoter activity was measured using whole-cell fluorescence of the wild-type strain carrying the reporter plasmid with 240 bp DNA upstream of hfpR (PhfpR). Bacteria were grown in iron depleted TYES broth (E20, 20 µM EDDHA) supplemented with a range of FeCl3 (upper panel) or with different iron sources (lower panel) as indicated. Cultures were inoculated at OD600 0.4 and fluorescence was measured during 5 h as described in materials and methods. Strain carrying the empty plasmid (Pless) was used as control. Values represent the mean and standard deviation of three independent experiments. (C) hfpR, 1813 and hfpY mRNA levels correlate with iron availability. RT-qPCR measurements were performed under iron depletion (upper panel) or high concentration of hemoglobin (lower panel) as described in Figure 2 using the wild-type strain grown in TYES broth, iron-depleted TYES (E20) supplemented with 1.25 µM haemoglobin (E20 Hb) or in TYES supplemented with 1% haemoglobin (Hb 1%).](/cms/asset/aa2d5e55-6282-45f9-b4da-e9e77afc6bf8/kvir_a_2101197_f0004_oc.jpg)
Figure 5. hfpR is required for in vitro growth under iron scarcity. Growth measured by optical density at 600nm of the wild-type, mutants and complemented strains (rows) under various conditions of iron availability (columns). Cultures were performed in TYES broth containing the iron chelator EDDHA 20 µM only (circle) or containing EDDHA and an iron source (triangle): 1.25 µM haemoglobin (left); 5 µM hemin (middle) and 5 µM FeCl3 (right). Growth curves in TYES broth were similar for all strains and are plotted for the WT panel only (diamond). Plain lines: wild-type and deletion mutants (ΔhfpR: red, ΔhfpY: blue, ΔbfpR: green, ΔhfpRΔbfpR: brown), dashed lines: ectopic complemented mutants. For mutants, growth curves of wild-type are in light grey for comparison purpose. Values represent the mean and standard deviation of three independent experiments. Growth with different iron sources were from independent experiments.
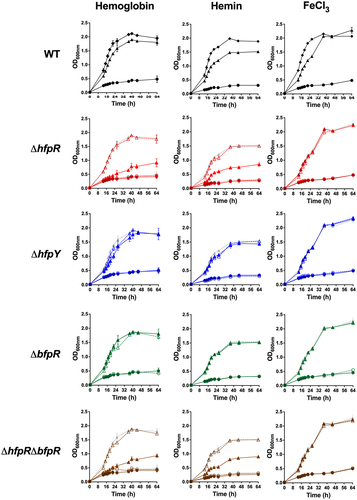
Figure 6. HfpY is a haem-binding protein. (a) UV-visible absorption spectra of MBP-HfpY complexed with hemin. 40 µM MBP-HfpY was purified from E. coli and mixed with equimolar concentration of hemin. UV-visible spectra (in 200 μl) of the complex and same concentration of hemin were obtained in a microplate spectrophotometer (Spark; Tecan). (Inset) 5X magnification of the 500- to 700 nm region. Results are representative of three independent experiments. (b) titration of MBP-HfpY with hemin followed by absorbance at 398 nm. 20 µM of MBP-HfpY were mixed with increasing concentrations of hemin as indicated. For each spectrum, the absorbance of the same concentration of hemin was subtracted and the difference absorption spectra are shown, from light to dark blue color as a function of hemin concentration. The absorption difference at 398 nm was plotted against hemin concentration (Inset). The curve is representative of 3 independent experiments and was fitted using the nonlinear regression function of GraphPad Prism 4 software, which determined that the stoichiometry of the HfpY-hemin complex was 1:1.
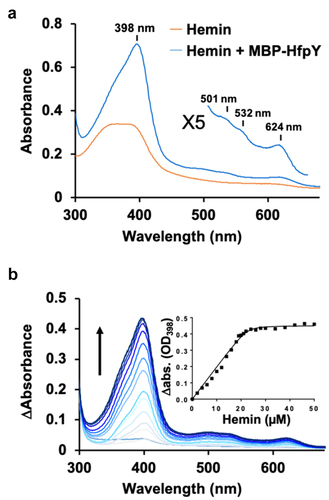
Figure 7. Evaluation of the virulence of wild-type and deletion mutant strains in rainbow trout. (a) bacterial loads in the spleen of rainbow trout fry after immersion challenge (A36 line, 2 g average weight). Each tank was inoculated at a bacterial concentration of 1 (±0.3) × 107 CFU/mL and fish were maintained in contact with bacteria for 24 h at 10°C under optimal oxygenation conditions. At the end of the challenge, bacterial concentration in water was 2 (±0.7) × 107 CFU/mL. Ten fish from each group were sacrificed at 6 h post-infection and bacterial loads in the spleen were determined. The colour of circles indicates strains: wild-type: black, ΔhfpR: red, ΔbfpR: green, ΔhfpRΔbfpR: brown, ΔhfpY: blue. Open circles are for corresponding ectopic complemented mutants. Horizontal dashed line indicates the detection threshold. Values are significantly lower in the spleen of groups infected with the ΔhfpR and ΔhfpY mutants compared to the wild-type and complemented strains (Mann–Whitney: *, 0.033; **, 0.002; ***, <0.001). (c) Kaplan–Meier survival curves of rainbow trout fingerling (Sy*Aut line, 5 g average weight) after intramuscular injection. Each group (n=10) was challenged at a dose corresponding to 10 x LD50 of the wild-type strain. Upper panel: 3 × 10⁶ CFU for the wild-type (black), 2 × 10⁶ CFU for ΔhfpR (red plain line) and ecto:hfpR (red dashed line); lower panel: 6 × 10⁶ CFU for the wild-type, 7 × 10⁶ CFU for ΔhfpY (blue plain line) and ecto:hfpY (blue dashed line). The survival curves for fish inoculated with either the wild-type or the ectopic complemented mutants were significantly different from those inoculated with the ΔhfpR or ΔhfpY mutants (p-value of the Mantel-Cox log-rank test is indicated). (c-d) experimental infection of juvenile rainbow trout (A36 line, 65 g average weight) after intramuscular injection. Fish were inoculated with 1 × 10⁷ CFU for the wild-type (black) or ΔbfpR mutant (green) strains; a subset (n = 12) was used for bacterial loads determination in blood, spleen and head kidney at 4 days post-infection (c) and another subset (n = 10) for survival estimation (d). Significant differences were observed between both the Kaplan–Meier survival curves (Mantel-Cox log-rank test p-value) and the bacterial loads (Mann–Whitney test).
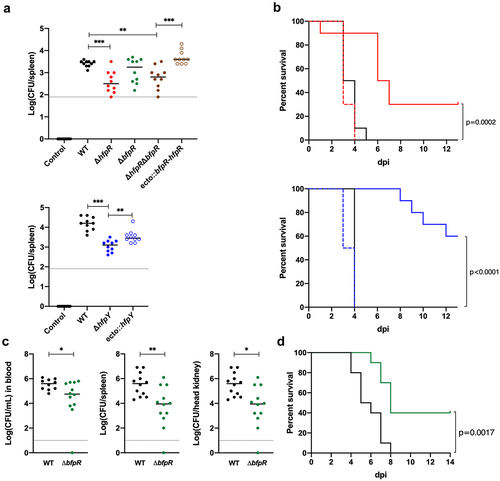
Figure 8. Graphical model of non-redundant haem/haemoglobin uptake systems of F. psychrophilum. This study showed that HfpR and BfpR outer membrane receptors both mediate haem uptake, but lack functional redundancy. We propose that HfpR and BfpR act in distinct environmental conditions during pathogenesis. During the early phase of infection, F. psychrophilum encounters low iron conditions due to the sequestration of essential nutrients by the host; iron is either bound to proteins or complexed in haem-binding proteins [Citation26]. The Hfp system is upregulated in low iron and mediates iron acquisition from haem or haemoglobin (Hb); our results indicate that the HfpY hemophore identified here outcompetes host sequestration systems. In contrast, BfpR is up-regulated in the presence of high amounts of haemoglobin from blood, an iron source available upon massive lysis of erythrocytes (RBC) during late stages of septicaemia. In these conditions, the Hfp system is strongly repressed and BfpR likely mediate haem uptake by direct binding to haemoglobin. One experiment, which needs to be reproduced, showed the importance of BfpR for full virulence in juvenile rainbow trout but not in fingerling. Altogether, these results suggest that F. psychrophilum evolved two haem acquisition systems to adapt to the range of substrate concentrations encountered during the infection process as well as to the physiological changes occurring during the life cycle of fish.
![Figure 8. Graphical model of non-redundant haem/haemoglobin uptake systems of F. psychrophilum. This study showed that HfpR and BfpR outer membrane receptors both mediate haem uptake, but lack functional redundancy. We propose that HfpR and BfpR act in distinct environmental conditions during pathogenesis. During the early phase of infection, F. psychrophilum encounters low iron conditions due to the sequestration of essential nutrients by the host; iron is either bound to proteins or complexed in haem-binding proteins [Citation26]. The Hfp system is upregulated in low iron and mediates iron acquisition from haem or haemoglobin (Hb); our results indicate that the HfpY hemophore identified here outcompetes host sequestration systems. In contrast, BfpR is up-regulated in the presence of high amounts of haemoglobin from blood, an iron source available upon massive lysis of erythrocytes (RBC) during late stages of septicaemia. In these conditions, the Hfp system is strongly repressed and BfpR likely mediate haem uptake by direct binding to haemoglobin. One experiment, which needs to be reproduced, showed the importance of BfpR for full virulence in juvenile rainbow trout but not in fingerling. Altogether, these results suggest that F. psychrophilum evolved two haem acquisition systems to adapt to the range of substrate concentrations encountered during the infection process as well as to the physiological changes occurring during the life cycle of fish.](/cms/asset/2b9fb315-3860-467d-a02e-d082b36a7f39/kvir_a_2101197_f0008_oc.jpg)
Supplemental Material
Download MS Word (2.7 MB)Data availability statement
The authors confirm that the data supporting the findings of this study are available within the article and its supplementary materials.