
Figures & data
Table 1. PCR primers used in the current study.
Figure 1. PrsA amino acid sequence conservation among pathogenic streptococci. (a) Alignment of the PrsA amino acid sequences from pathogenic streptococci. The sequences were obtained from the NCBI database. A high degree of sequence conservation was observed. (b) Homology tree of PrsA amino acid sequences from pathogenic streptococci.
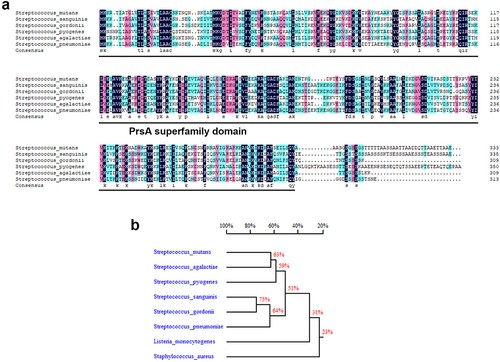
Figure 2. PrsA-Deficient mutant strain shows reduced ability to promote vegetation formation in a rat model of IE in rats. Investigation of the role of PrsA in the pathogenesis of IE using GS5 wild-type, ΔprsA, and comΔprsA strains in rat models of endocarditis. (a) Vegetation formation on the heart valves of endocarditis rats. Markers represent vegetation (black arrows) and valves (dashed lines). Scale bars represent 1 mm. (b and c) the number of colonized bacteria inside vegetation (b) and vegetation size (c) was measured. Data are presented as a scatter plot with mean ± standard error of the mean. **P < 0.001, *P < 0.05 by Kruskal–Wallis test with subsequent Dunn’s test; ns, not significant. (d) Three-dimensional structure of GFP-tagged S. mutans biofilms inside the vegetation that was harvested from injured heart valves and observed by confocal laser scanning microscopy (630× magnification). Bars indicate 50 μm.
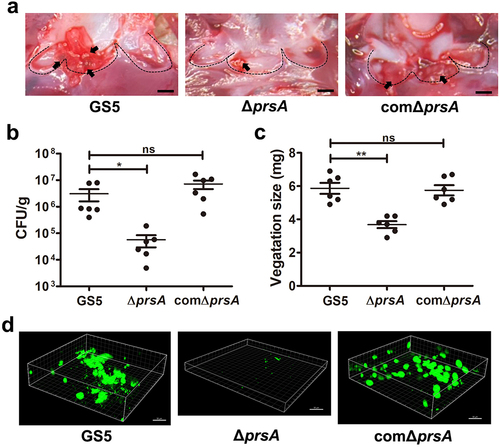
Figure 3. PrsA mediates S. mutans cell separation, autolysis, eDNA release, and eDNA-dependent biofilm formation. (a) the bacterial growth was measured by detecting the absorbance of cultures at 550 nm. (b) Appearance of S. mutans GS5 wild-type, ΔprsA, and comΔprsA in the stationary phase were observed by light microscopy. (c) Bacterial autolysis assessed by measuring the OD550 of the cell suspensions. Data are expressed as the mean ± standard deviation of triplicate data. The values at 24 h were analyzed by 1-way ANOVA, ***P < 0.001. (d and e) Semi-quantitative analysis of bacterial eDNA release by conventional PCR and quantitative PCR (qPCR). Conventional PCR products obtained with 16S rRNA primers were analyzed on 1% agarose gels, and data of qPCR are represented as the mean of Ct values with SEM, and analyzed by 1-way ANOVA, *P < 0.001, *P < 0.05. Each spot represents the value from an independent culture. (f) Quantification of S. mutans biofilm formation using a crystal violet staining assay. Means of OD550 absorbance readings ± standard deviation of triplicate data are shown, and the data were statistically analyzed by 1-way ANOVA. **P < 0.01, ns, not significant. (g) Confocal laser scanning microscopy images of S. mutans biofilms (630× magnification). S. mutans GS5 wild-type and mutant strains were transformed with pPdgfpuv (green), and bacterial eDNA was stained with 10 μM propidium iodide (PI). GFP, green fluorescent protein. (h) Quantification of eDNA inside biofilms by detecting the fluorescence intensity of propidium iodide staining. The quantified values of the extended focus images of biofilms were determined using ImageJ software. The data were analyzed by 1-way ANOVA from three independent experiments and are presented as the mean value ± standard deviation. **P < 0.01, ***P < 0.001 by. ns, not significant. (i) Quantification of biofilm by crystal violet staining. S. mutans GS5 wild-type or ΔprsA were grown in culture medium with or without a concentration series of bacterial DNA. The data are presented as the mean ± standard deviation, and were analyzed by 1-way ANOVA. **P < 0.01, ***P < 0.001. The results for a representative experiment from three independent experiments are shown. The results of two other repeats were available in Supplemental Materials.
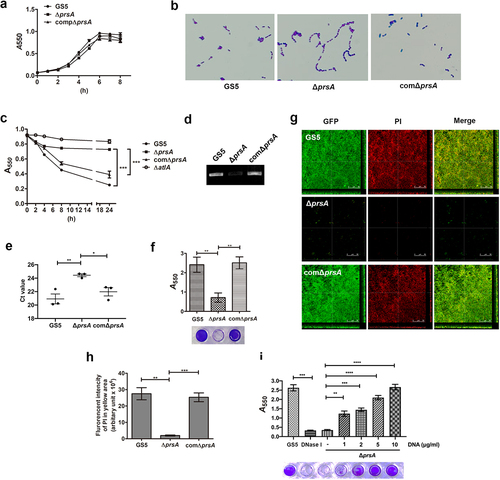
Figure 4. PrsA mediates in vivo eDNA-dependent biofilm formation. (a) Confocal laser scanning microscopic images of biofilm formation inside the vegetation (630× magnification). S. mutans GS5 wild-type and mutant strains were transformed with pPdgfpuv (green), and bacterial eDNA was stained with 10 μM propidium iodide (PI). GFP, green fluorescent protein. The red arrows indicate small bacterial aggregates without eDNA inside, and white arrows indicate the presence of both S. mutans and eDNA (yellow areas). The images shown are representative of three independent experiments. (b) Quantification of the eDNA inside the bacterial biofilms (yellow areas) by measuring the fluorescence intensity of propidium iodide staining. The quantified values of the extended focus images of biofilms were detected using ImageJ software. The data are presented as scatter plots with mean ± standard deviation. ***P < 0.001 by 1-way ANOVA. (c, d and e) Semi-quantification of bacterial eDNA inside the vegetation. Total DNA of vegetation was extracted without lysing bacteria, and the bacterial 16S rRNA gene was amplified by conventional PCR or quantitative PCR (qPCR) with specific primers. Conventional PCR products were analyzed on 1% agarose gels (c) and the intensity was semi-quantified using ImageJ software (d). Data of qPCR are represented as Ct values (e). These data were statistically analyzed by 1-way ANOVA and presented as scatter plots with means ± standard deviation from three independent experiments, ***P < 0.001, **P < 0.01, *P < 0.05.
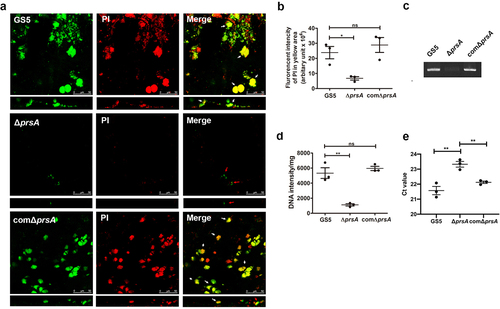
Figure 5. PrsA mediates surface exposure and secretion of AtlA. (a) Cell wall/envelope-associated proteins of S. mutans GS5 wild-type, ΔprsA, and comΔprsA were extracted with 4% sodium dodecyl sulfate (SDS) sample buffer. AtlA was detected by western blotting. (b and c) AtlA exposure on the bacterial surface detected by whole-cell ELISA (b) and immunofluorescence staining using anti-AtlA antibodies (c). Data of whole-cell ELISA are presented as the means ± standard deviation of triplicate data, and were analyzed by 1-way ANOVA. ***P < 0.001, ns, not significant. The result is a representative experiment from three independent experiments. The results of two other repeats were available in Supplemental Materials. (b). Immunofluorescence staining of AtlA on the bacterial surface was detected by ZEISS Apotome 3D Super Resolution Microscopy (c). Bar indicates 1μm. (d) AtlA secretion to the culture medium detected by western blotting. Cell-free overnight culture supernatants from S. mutans wild-type, ΔprsA, and comΔprsA were concentrated 20-fold, and analyzed by western blotting using anti-AtlA antibodies. (e) Cell wall pulldown of bacterial proteins in the culture supernatant of S. mutans wild-type, ΔprsA, and comΔprsA detected by western blotting using anti-AtlA antibodies.
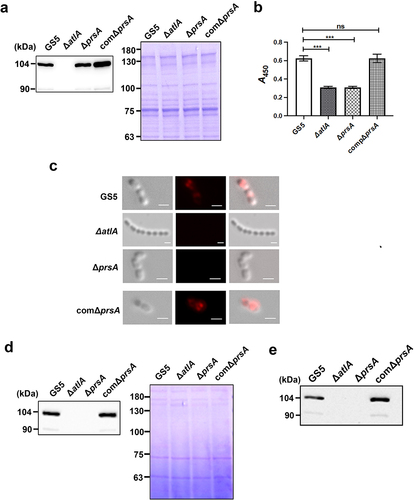
Figure 6. Addition of recombinant AtlA to the culture medium restores the capacity of the prsA-deficient mutant strain to form eDNA-dependent biofilm. (a) Bacterial autolysis assessed by measuring the OD550 of the cell suspension of the prsA-deficient mutant strain containing a concentration series of recombinant AtlA (rAtla). Data are expressed as the mean ± standard deviation of triplicate data; values at 24 h were analyzed by 1-way ANOVA, ***P < 0.001. (b) Quantification of biofilms of prsA-deficient mutant strain (ΔprsA) cultured in medium containing indicated concentrations of recombinant rAtla using a crystal violet staining assay. The experiment was performed in triplicate, and the data are presented as the mean ± standard deviation, and were analyzed by 1-way ANOVA. ***P < 0.001, ns, not significant. (c) Confocal laser scanning microscopy images of ΔprsA biofilms cultured in medium containing a series of rAtla concentrations (630× magnification). S. mutans GS5 wild-type and mutant strains were transformed with pPdgfpuv (green), and bacterial eDNA was stained with 10 μM propidium iodide (PI). GFP, green fluorescent protein; PI, propidium iodide. (d) Quantification of eDNA inside the biofilm by detecting the fluorescence intensity of propidium iodide staining. The quantified values of the extended focus images of biofilms were detected using ImageJ software, and statistically analyzed by 1-way ANOVA. The means ± standard deviation of three independent experiments is presented. ***P < 0.001, **P < 0.01, and *P < 0.05. (e) Quantification of S. mutans biofilm by a crystal violet assay. S. mutans GS5 wild-type and ΔprsA biofilms were grown in the culture medium with or without 20 μg/ml rAtla or 5 unit/ml DNase I. Means of OD550 absorbance readings ± standard deviation of triplicate data is shown; ***P < 0.001 by 1-way ANOVA. The results for a representative experiment from three independent experiments are shown. The results of two other repeats were available in Supplemental Materials.
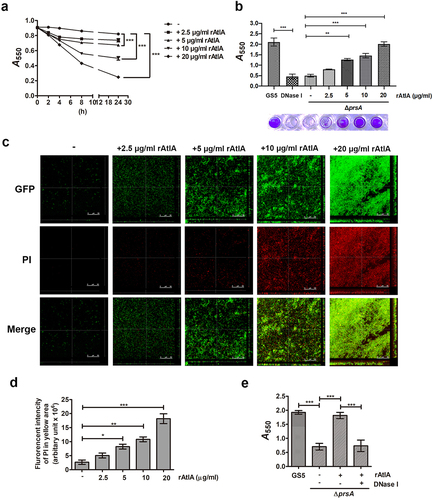
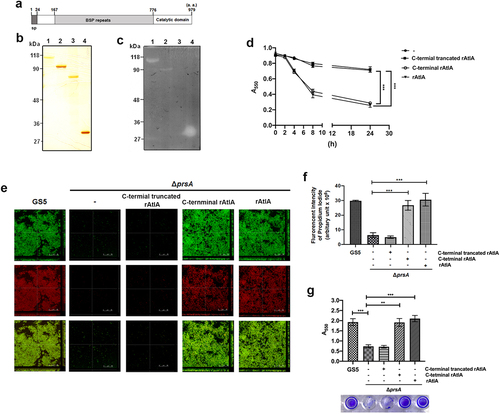
Figure 7. AtlA enzyme activity is important to PrsA-mediated bacterial autolysis and biofilm formation. (a) Schematic representation of the domain structure of AtlA. sp, signal peptide. (b) the virous recombinant AtlA proteins (rAtla) were separated by SDS-PAGE followed by silver staining. Lane1, full length of AtlA (residues 24–979); lane 2, mature form of AtlA (residues 167–979); 3, C-terminal truncation isoform (residues 167–776); lane 4, putative catalytic domain of AtlA (residues 776–979) (c) Zymographic analysis of rAtla enzyme activities. The rAtla proteins were separated by SDS-PAGE containing 1% (wet weight) heat-killed S. mutans cells. (d) Bacterial autolysis assessed by measuring the OD550 of the cell suspension of the prsA-deficient mutant strain containing 20 μg/ml indicated rAtla isoforms. The experiment was performed in triplicate and repeated three time. Data are expressed as the mean ± standard deviation of triplicate data. The values at 24 h were analyzed by 1-way ANOVA, ***P < 0.001. (e) Confocal laser scanning microscopy images of ΔprsA biofilms cultured in medium containing 20 μg/ml indicated rAtla isoforms (630× magnification). S. mutans GS5 wild-type and mutant strains were transformed with pPdgfpuv (green), and bacterial eDNA was stained with 10 μM propidium iodide (PI). GFP, green fluorescent protein; PI, propidium iodide. (f) Quantification of eDNA inside the biofilm by detecting the fluorescence intensity of propidium iodide staining. The quantified values of the extended focus images of biofilms were detected using ImageJ software, and statistically analyzed by 1-way ANOVA. The means ± standard deviation of three independent experiments is presented. ***P < 0.001. (g) Quantification of S. mutans biofilm by a crystal violet assay. S. mutans GS5 wild-type and ΔprsA biofilms were grown in the culture medium with or without 20 μg/ml indicated rAtla isoforms. Means of OD550 absorbance readings ± standard deviation of triplicate data are shown; ***P < 0.001, **P<0.01, by 1-way ANOVA. The results for a representative experiment from three independent experiments are shown. The results of two other repeats were available in Supplemental Materials.
Supplemental Material
Download Zip (2.9 MB)Data availability statement
The authors confirm that the data supporting the findings of this study are available within the article and its supplementary materials.