
Figures & data
Figure 1. NDV infection induced amino acid metabolic reprogramming in host cells to match composition of NDV particles. (a-b) Changes to amino acid metabolism in NDV-infected DF-1 cells (a) and A549 cells (b). DF-1/A549 cells were infected with NDV Herts/33 at 1 MOI, then harvested at 12 h.p.i. For metabolomic analyses. (c-e) Amino acid profile analysis of DF-1 cells (c), A549 cells (d), and NDV Herts/33 particles (e). DF-1/A549 cells were washed with ice-cold PBS, and the supernatant was centrifugated. After freeze-drying, DF-1/A549 cell samples were dissolved in sterile water. NDV Herts/33 particles were prepared using a red blood cell absorption method as described previously [Citation33]. These samples were then subjected to amino acid profile analysis.
![Figure 1. NDV infection induced amino acid metabolic reprogramming in host cells to match composition of NDV particles. (a-b) Changes to amino acid metabolism in NDV-infected DF-1 cells (a) and A549 cells (b). DF-1/A549 cells were infected with NDV Herts/33 at 1 MOI, then harvested at 12 h.p.i. For metabolomic analyses. (c-e) Amino acid profile analysis of DF-1 cells (c), A549 cells (d), and NDV Herts/33 particles (e). DF-1/A549 cells were washed with ice-cold PBS, and the supernatant was centrifugated. After freeze-drying, DF-1/A549 cell samples were dissolved in sterile water. NDV Herts/33 particles were prepared using a red blood cell absorption method as described previously [Citation33]. These samples were then subjected to amino acid profile analysis.](/cms/asset/e6a6eb5b-5bf0-4f25-ae70-bbfc3d950a2f/kvir_a_2112821_f0001_b.gif)
Figure 2. NDV infection induced significant SLC1A3 upregulation. (a-c) A549 cells were harvested at 6, 12, 18 and 24 h.p.i. after NDV infection (Herts/33 or LaSota or SH15), and non-infected cells were used as the control. The mRNA levels of different amino acid transporters (SLC1A2, SLC1A3, SLC25A25, SLC7A14, SLC7A7, SLC6A19, SLC38A2) were determined using qRT-PCR. β-actin was used as an internal reference gene. (d) A549 cells were harvested at 12 and 24 h.p.i. after NDV infection (Herts/33, MOI=1). The mRNA levels of the SLC1 family were detected after NDV infection in A549 cells. (e) A549 cells were harvested after NDV infection (Herts/33, MOI=0.1, 0.5, 1, 5) and were used to detect the mRNA levels of SLC1A3. (f) Amino acid transporters and their substrates. (g-h) the expression levels of SLC1A3 were detected in A549/DF-1 cells post-NDV infection.
Figure 3. NDV replication level was decreased after knocking down SLC1A3. (a) A549 cells were transfected with siRNA (si-A3 and si-NC) followed by NDV (Herts/33, MOI= 0.1/1) infection, and cells were harvested to determine the effect of SLC1A3 siRNA using qRT-PCR. (b, c) After treatment with siRNA, NDV-infected A549 cell samples and supernatant were harvested for TCID50 measurement of NDV titers, and the cells were subjected to western blot analysis of the SLC1A3 and NP expression. (d, e) A549 cells (Control and shSLC1A3) were infected with NDV (Herts/33, MOI=0.1/1), and cell samples and supernatant were harvested for western blot and TCID50 detection. (f, g) Cell proliferation activity of A549 cells (Control and shSLC1A3) (F) and cells infected with NDV Herts/33 (MOI=0.1) (g) were measured using the Enhanced Cell Counting Kit-8. (H) the growth curve of NDV in A549 cells (Control and shSLC1A3). Cells were infected with NDV Herts/33 (MOI=0.1). Supernatants were harvested at the indicated times and were subjected to the TCID50 assay. (I) After treatment with TFB-TBOA, a glutamate transporter inhibitor, cells infected with NDV (Herts/33, MOI=1) were harvested at 12 h for western blot detection.
Figure 4. SLC1A3 was located on the cell membranes, mitochondria, and lysosomes. (a-c) A549 cells were infected with NDV (Herts/33, MOI=1) for 18 h, followed by western blot analysis. SLC1A3 was detected using anti-SLC1A3 antibody. Cell plasma membranes were stained green. Lysosomes were detected using anti-LAMP1 antibody and stained red. Mitochondria were stained red. Cell nuclei were stained blue. Scale bars: 10 μm. (d-f) NDV-infected A549 cell samples were harvested at 6, 12, and 18 h.p.i., then underwent plasma membrane protein isolation, lysosome enrichment, and cell mitochondria isolation. Expressions of Na, K-ATPase (d), LAMP1(e), and COX IV (f) in isolated samples were analyzed using western blot and antibodies against Na, K-ATPase, LAMP1 and COX IV. Expression levels of SLC1A3 and β-actin were also detected. (g, h) Treatment with CQ, a lysosome inhibitor, inhibited SLC1A3 and NDV NP expression (g) and decreased virus titers (H), as detected using western blot and TCID50 assay at 12 and 24 h.p.i.
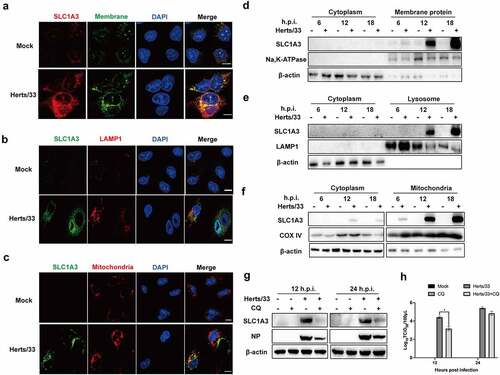
Figure 5. Detection of NDV replication levels after treatment with different culture media. (a) Microscopic observation of NDV-infected A549 cells in different culture media at 18 h.p.i. Cells were infected with NDV (Herts/33, MOI=1) and incubated at 37°C with 5% CO2 for 1 h. Thereafter, the virus inoculum was removed by washing with PBS and were exposed to various culture media. Culture media were prepared as follows: complete culture medium (NC), and media that only lacked glutamine (−gln), glutamate (−glu), asparagine (−asn), aspartate (−asp), or glucose (−glc). (b) the replication level of NDV in different culture media. A549 cells were infected with NDV Herts/33 at 1 MOI in the absence of a certain nutrient component and cell samples were harvested at 12 and 24 h.p.i. For western blot analysis. (c) the NDV replication level in culture media containing only one nutrient (glutamine, glutamate, asparagine, or aspartate). A549 cells were infected with NDV Herts/33 at 1 MOI and cell samples were harvested at 12 and 24 h.p.i. For western blot analysis.
Figure 6. NDV replication relied on glutamine in a dose-dependent manner. (a, b) A549 cells were infected with NDV (Herts/33, MOI=1) for 1 h, and the supernatant was removed by washing with PBS. Thereafter, cells were exposed to culture media containing various glutamine concentrations at 1 h post infection, followed by western blot analysis and TCID50 assay. (c-e) A549 cells were infected with NDV (Herts/33, MOI=1) for 1 h and then were exposed to complete culture medium (NC), glutamine-free medium (−gln), or glutamine-free medium supplemented with various concentrations of glutamate (Glu), aspartate (Asp), and asparagine (Asn). Cells were then harvested for western blot analysis.
Figure 7. SLC1A3 was involved in glutamine catabolism regulation during NDV infection. (a) Schematic diagram of the metabolic flow of labeled carbon atoms in the TCA cycle. Black dots denote 13C atoms originating from uniformly U-13C5-labeled glutamine. (b) A549 cells infected with NDV (Herts/33, MOI=1) received complete culture medium labeled with U-13C5-labeled glutamine. At 18 h.p.i., glutamine and glutamate were analyzed via metabolic analysis. (c, d) TCA cycle intermediates were analyzed using LC-MS. (E-H) A549 cells (Control and shSLC1A3) were or were not infected with NDV (Herts/33, MOI=1) and received complete culture medium labeled with U-13C5-labeled glutamine. At 18 h.p.i., intracellular glutamine and glutamate were quantified by metabolic analysis (e, f). Stable isotopomer tracing analysis of U-13C5-labeled glutamine incorporation into reduction reactions and TCA cycle intermediates was conducted (G, H). (I) After treatment with siRNA, A549 cells infected with NDV (Herts/33, MOI=1) were harvested at 24 h.p.i. For western blot analysis. GLS1, SLC1A3, and β-actin were detected using corresponding antibodies.
Figure 8. The expression levels of SLC1A3 decreased after treatment with p53 and NF-κB pathway inhibitors. (a, b) in the presence of the p53 inhibitor PFTα (10, 20, or 50 μM), A549 cells infected with NDV (Herts/33, MOI=1) were harvested for western blot analysis and qRT-PCR. Antibodies against phopho-p53, total p53, p21, SLC1A3, NDV-NP, and β-actin were used. The mRNA levels of SLC1A3 were analyzed using qRT-PCR. (c, d) Under BAY 11–7082 (10 μM) treatment, A549 cells infected with NDV (Herts/33, MOI=0.1, 1) were harvested for western blot and qRT-PCR analysis. Antibodies against phopho-IκBα, total IκBα, SLC1A3, NDV-NP, and β-actin were used. DMSO was used as a control. The mRNA levels of SLC1A3 were analyzed using qRT-PCR.
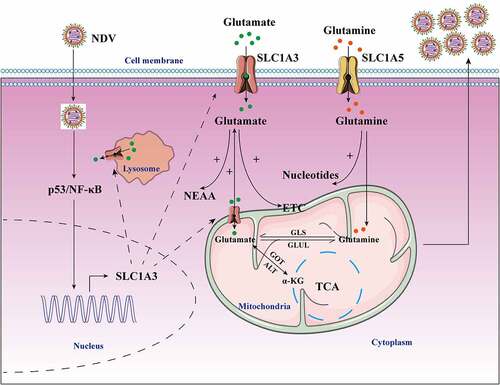
Figure 9. Schematic diagram of the molecular mechanism of NDV-mediated glutamine metabolism. NDV infection induced metabolic reprogramming in host cells to benefit viral protein synthesis and replication. NDV infection facilitated glutamate transport by increasing SLC1A3 expression on cell membranes, lysosomes, and mitochondria in infected cells by activating p53 and NF-κB pathways. The transportation of glutamate contributes to maintaining functionality of the TCA cycle and the electron transport chain, as well as providing energy for viral replication. Glutamate can also produce some nonessential amino acids. In addition, glutamine can also be used for viral nucleotide synthesis. All these factors provide favorable conditions for viral replication during NDV infection.
Supplemental Material
Download Zip (2.8 MB)Data availability statement
The data used to support the findings of this study are available from the corresponding author upon request ([email protected]).