Figures & data
Figure 1. Mutations in SCV1 is not involved in phage resistance. (a) Mutations identified in the SCV1 strain compared to the B1 strain by whole-genome sequencing. The sequencing datasets of SCV1 were analysed using the B1 genome as a reference. 3 deletions, 26 insertions and 9 SNPs in the SCV1 were identified by mapping to the genome of B1 strain. The position of mutant bases was shown in the genome of reference strain B1. The deletions were in red font; the insertions were in green font; the SNPs were in blue font. Image is generated using BRIG (http://brig.sourceforge.net). (b) the relative transcription levels of the 30 mutated genes in the SCV1 strain compared with the B1 strain. (c) the titre of phage G65 cocultured with B1, SCV1 or its complementation strain with a single gene (U876_15465, U876_14230, U876_19620, U876_06585, U876_01305 or U876_18155) amplified from the B1 genome. The values are the mean ± sd from three biological replicates. ** P <0.01 or ***P <0.001.
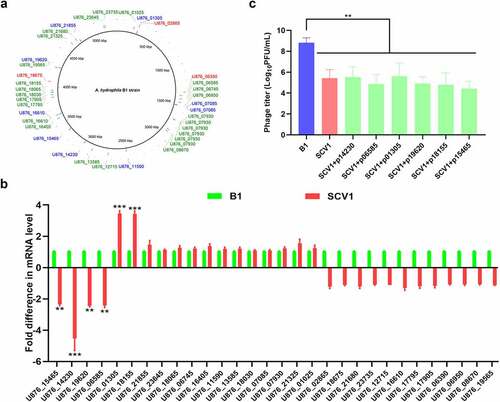
Figure 2. Comparative transcriptomics analysis. (a) Volcano plot of differentially expressed genes between SCV1 (Tetrahymena-exposed) and B1 (non-Tetrahymena-exposed). (b) Clustering heatmap of DEGs between the B1 and SCV1 strains. (c) qRT-PCR validation of the transcription of selected DEGs. The data indicate the fold change in the expression of genes in SCV1 compared with B1. (d) GO enrichment analysis. (e) KEGG pathway analysis.
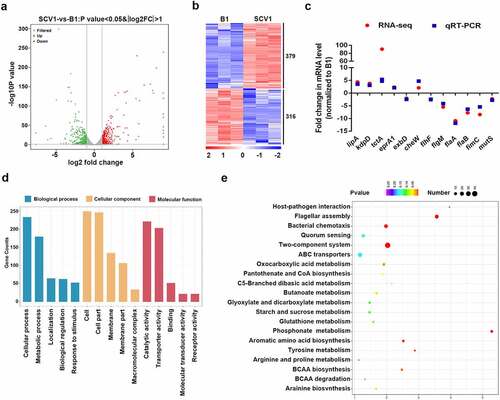
Figure 3. Downregulation of flhF is involved in cell aggregation and phage resistance in SCV1 (a) Colony (scale bar = 1 cm) and microscopic morphology (scale bar = 40 μm) of B1 and its derivative flhF mutant (ΔflhF) and the complemented strain (CΔflhF), as well as SCV1 and its flhF-overexpressing strain (SCV1:flhF). (b) Growth curves of B1, ΔflhF, CΔflhF, SCV1, and SCV1:flhF. (c) the titre of phage G65 cocultured with B1, ΔflhF, CΔflhF, SCV1, and SCV1:flhF. (d) Adsorption kinetics of phage G65 to the indicated strains. The adsorption curve was drawn with time as the abscissa and the percentage of unadsorbed free phages as the ordinate. The data are presented as the mean ± SD of three independent experiments, with each experiment consisting of three replicates.
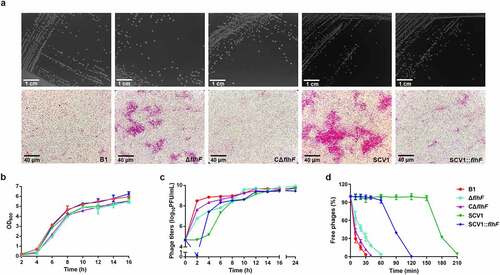
Figure 4. Phage resistance of SCV1 is independent of the impaired flagellar production. (a) Motility of B1, ΔflhF, CΔflhF, SCV1, and SCV1:flhF. Motility was observed after culturing at 28°C for 48 h on 0.3% LB agar plates. Migration diameter was measured to assess motility. (b) the expression and secretion of flagellins FlaA and FlaB analysed by western blotting. Polyclonal anti-FlaA and anti-FlaB antibodies were used to measure the production of FlaA and FlaB, respectively. The whole-cell fractions (WF) and supernatant fractions (SF) were harvested, respectively, when the indicated strains were grown to logarithmic phase in LB broth. The samples were probed with anti-GroEL antibody as a cell lysis control for SF and a loading control for WF. (c) TEM images of the indicated strains. Scale bar = 1 μm. The red arrow indicates the flagellum. (d) the titre of phage G65 coculture with the B1 and ΔflaAB strains. The concentration of phages was determined using standard double agar overlay plaque assay. Phage titre as indicated by log10 PFU per mL. (e) Adsorption kinetics of G65 to B1 and ΔflaAB strains. The adsorption curve was drawn with time as the abscissa and the percentage of unadsorbed free phage as the ordinate. The data are presented as the mean ± SD of three independent experiments, with each experiment consisting of three replicates. “ns” signifies not statistically significant.
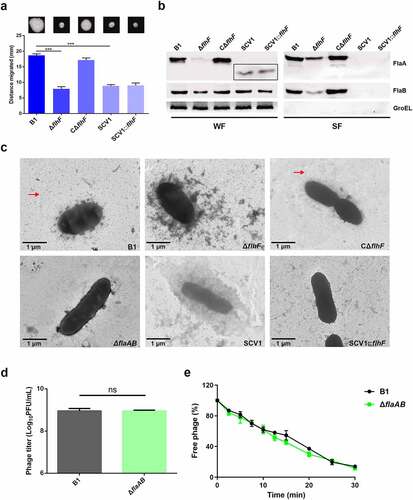
Figure 5. Protein components of the extracellular matrix hinder the adsorption of phage G65 to SCV1. (a) TEM images of the B1 strain and the SCV1 strain with or without proteinase K or NaIO4 treatment. Scale bar = 1 μm. The SCV1 strain was treated with proteinase K (0.1 mg/ml) or NaIO4 (2.14 mg/ml) for 2 h after growth in LB medium to logarithmic phase and then observed by TEM. The red arrow indicates the extracellular matrix. (b) the titre of phage G65 after incubation with the SCV1 strain with or without proteinase K or NaIO4 treatment. Proteinase K (0.1 mg/ml) or NaIO4 (2.14 mg/ml) was added 2 hours prior to coculture with phage G65. The concentration of phages was determined using standard double agar overlay plaque assay. Phage titre as indicated by log10 PFU per mL. The B1 strain with the same treatments as a control. (c) Adsorption kinetics of G65 to the B1 and SCV1 strains after treatment with proteinase K or NaIO4. the adsorption curve was drawn with time as the abscissa and the percentage of unadsorbed free phage as the ordinate. * P <0.05, ** P <0.01.
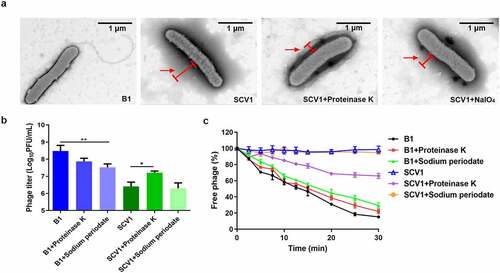
Figure 6. Downregulation of flhF in SCV1 is responsible for excessive extracellular proteins. (a) SDS-PAGE analysis of the culture supernatants of B1, ΔflhF, CΔflhF, SCV1 and SCV1:flhF. Culture supernatants collected from logarithmic-phase cultures normalized at the same OD600 were separated by SDS-PAGE and silver stained. The samples were probed with α-GroEL as a cell lysis control for secreted fractions and a loading control for whole-cell fractions. WF: whole-cell fractions; SF: secreted fractions. (b) the levels of extracellular protein of the indicated strains. The supernatant fractions were harvested when the A. hydrophila strains were grown for 6 hours in LB broth. Protein secretion was measured by the BCA assay.
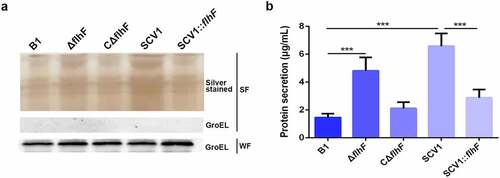
Figure 7. Downregulation of flhF is responsible for the secretion of haemolysin co-regulated protein (Hcp) and haemolysin (AHH1). (a) the expression and secretion of Hcp and AHH1 were determined by Western blot analysis. The samples were probed with anti-GroEL antibody as a cell lysis control for secreted fractions (SF) and a loading control for whole-cell fractions (WF). (b) the haemolytic activity of B1, ΔflhF, CΔflhF, SCV1 and SCV1:flhF. The haemolytic activity is expressed as the fold dilution of the A. hydrophila culture filtrates that led to the lysis of 50% of the erythrocytes. (c) the antibacterial competition capability of B1, ΔflhF, CΔflhF, SCV1 and SCV1:flhF. The antibacterial competition capability of the indicated strains against E. coli BL21 was defined as the amount of surviving E. coli after challenge. The values are the mean ± sd from three biological replicates. * P <0.05, ** P <0.01 or ***P <0.001.
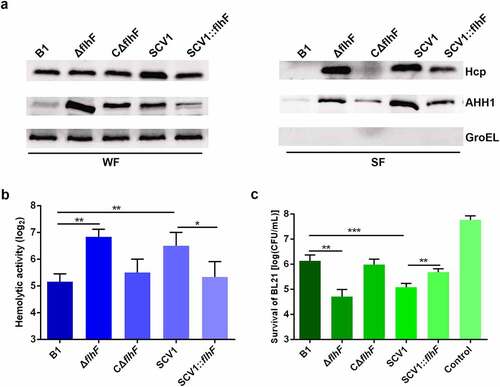
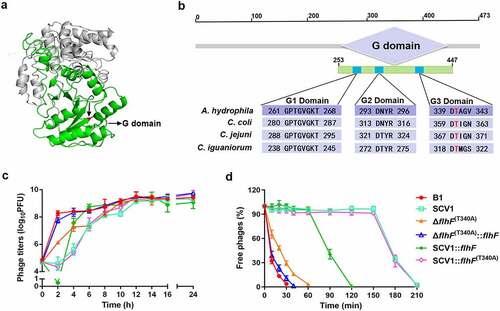
Figure 8. The key residue of FlhF activity is crucial for phage resistance. (a) the 3D structure of FlhF of A. hydrophila NJ-35. The G domain is shown in green and the Thr-340 residue is shown in red. (b) Clustal omega alignment of the G1, G2 and G3 subdomains of the FlhF protein orthologs from A. hydrophila NJ-35 (GenBank accession NZ_CP006870.1), Campylobacter coli RM4661 (GenBank accession CP007181.1), C. jejuni PT14 (GenBank accession NC_018709.4) and Campylobacter iguaniorum 1485E (GenBank accession CP009043.1). The G domain functions as a GTPase and contains multiple conserved subdomains, as indicated by G1, G2 and G3. (c) the titre of phage G65 cocultured with B1, SCV1, ΔflhF (t340a), ΔflhF (T340A):flhF, SCV1:flhF and SCV1:flhF (t340a). (d) Adsorption kinetics of G65 to the indicated strains. ΔflhF (t340a): a strain with a mutation in the Thr-340 residue of FlhF; ΔflhF (T340A)::flhF: a strain with the overexpression of flhF in ΔflhF (t340a); SCV1:flhF (t340a): a strain with the overexpression of flhF (t340a) in SCV1.