
Figures & data
Figure 1. WOR1 overexpression suppresses fitness defects of hog1 mutants.
Note: Competition assays of hog1-RFP and hog1-WOR1OE (HW1) cells in C57BL/6 mice (n = 4–6). Oral antibiotic therapy without (A) or with doxycycline (B) was administered 4 days before a gavage of 107 cells in a 1:1 mixture (day 0) and maintained throughout the experiment. Fungal loads detected by CFUs counting along the time (days) are represented as the mean ± SD and are spotted at the indicated time points (days). C) Colonization loads of the hog1-WOR1OE strain in a single colonization assay.
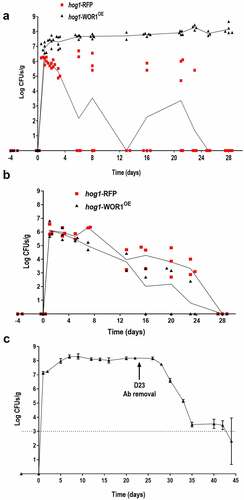
Figure 2. Competition of hog1-WOR1OE cells with wild-type cells.
Note: Antibiotic therapy in drinking water was given to mice (n = 4–6) starting 4 days before a gavage of 107 cells in a 1:1 mixture of hog1-WOR1OE (HW1) and CAI4-RFP (day 0) was administered. Fungal loads detected by CFUs counting along the time (days) are represented as the mean ± SD. B) Comparison of percentages of the CAI4-RFP and hog1-WOR1OE strains in the inoculum and in fecal samples at early time points (mean± SD). Ordinary one-way ANOVA plus Dunnett multiple comparisons test was used for statistical analyses. *p < 0.05, **p < 0.01, ***p < 0.001, ****p < 0.0001. C) Postmortem analysis of the relative colonization ratios of CAI4-RFP/hog1-WOR1OE along the gastrointestinal tract at day 25 is represented as the mean± SD. D) Tenfold serial dilutions of overnight growing cultures of the indicated strains were spotted on YPD plates supplemented with 0.1% and 0.2% Bile salts and incubated at 37°C for 48 h before being scanned.
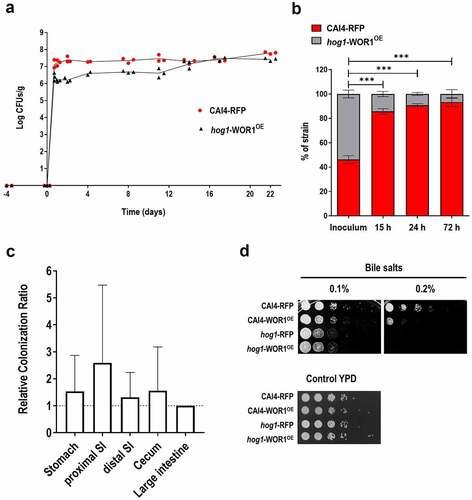
Figure 3. Effect of overexpression of WOR1 in hog1 cells adhesion.
Note: The Adhesion Relative Index (ARI) was determined for the CAI4-RFP (control), hog1, and hog1-WOR1OE strains compared to the wild-type strain CAI4-RFP in the large intestine (LI) and/or polystyrene (A) or to the adenocarcinoma cell-line HT29 (B and C). Individual values are plotted with the mean ± SEM. Ordinary one-way ANOVA plus Tukey multiple comparisons test or unpaired t-test was used for statistical analyses. Ns no significant, *p < 0.05, **p < 0.01, ***p < 0.001.
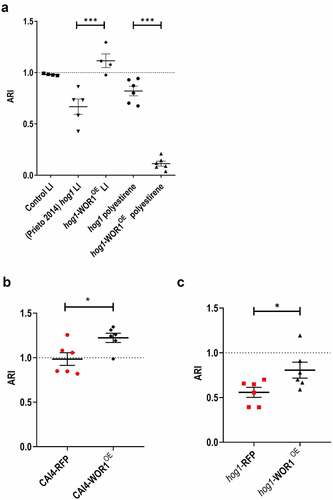
Figure 4. Role of Als3 in fitness.
Note: ALS3 transcription level was measured by quantitative RT-qPCR.ACT1 mRNA was used as internal control and fold increase over ALS3 mRNA in the CAI4-pNRUe in the indicated strains was represented. Each qPCR (three biological replicates) provided three intraexperiment values and are shown as the mean ± SD. Ordinary one-way ANOVA plus Dunnett multiple comparisons test was used for statistical analyses. *p < 0.05, **p < 0.01, ***p < 0.001, ****p < 0.0001. B) Competition between wild-type CAF2-RFP and als3 mutant strain colonization in C57BL/6 antibiotic treated mice (n=3). Fungal loads determined by CFU counting of each strain are represented at different time points (days) as mean ± SD. C) The Adhesion Relative Index (ARI) was determined for the als3 mutant compared to the wild-type strain CAF2-RFP in the large intestine ex vivo like . Paired t-test was performed for statistical analyses. ns, not significant.
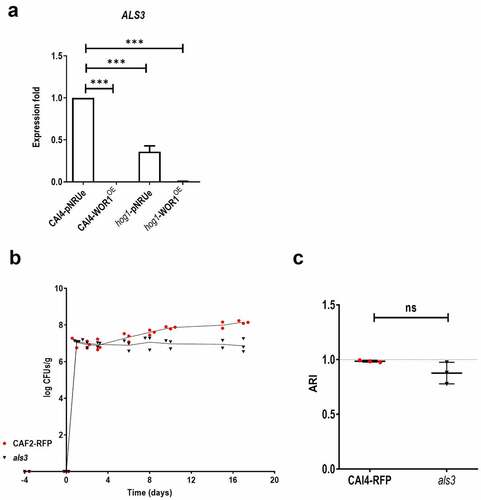
Figure 5. Effect of Wor1 overproduction in hog1 morphogenesis.
Note: A) Overnight cultures of the indicated strains were diluted in fresh YPD liquid media and incubate at 37ºC. At 0, 90, and 180 min after dilution, samples were obtained from cultures and photographed. B) Overnight cultures of the indicated strains were diluted in fresh YPD, YPD 10% FBS, or FBS 100% and incubated at 37ºC. Representative microscopic images at 2 and 6 hours are shown. C) Relative transcript levels of ECE1, HWP1, and EFG1 in the indicated strains are compared to the CAI4-pNRUe control strains determined by RT-qPCR using ACT1 transcript as internal control. Each qPCR (three biological replicates) provided three intraexperiment values and are shown as the mean ± SD. Ordinary one-way ANOVA plus Tukey multiple comparisons test was used for statistical analyses. *p < 0.05, **p < 0.01, ***p < 0.001, ****p < 0.0001. ns, not significant.
Figure 6. Determination of phospholipase and protease activity in WOR1OE cells.
Note: Phospholipase and protease activities were determined on MEA and SEA 0.5 M NaCl or BSA agar plates, respectively, from overnight growing cells. 6.25x10⁴ cells were deposited onto agar plates and were incubated 96 (MEA and SEA plates in normoxia) or 120 hours (BSA plates in normoxia, Nor, or microaerophilia, Mic) before scanned (A). Hydrolysis halos (mm) were measured and represented for all the strains on SEA (B), MEA (C) and BSA (D) plates.
Figure 7. Effect of Wor1 overproduction in mouse viability (in a systemic candidiasis model).
Note: Survival curves of C57BL/6 systemically infected mice with 3x10⁵ cells of the indicated strains and data were plotted using the Kaplan–Meier method.
Table 1. Candida albicans strains used in this work.
Supplemental material
Supplemental Material
Download Zip (1.1 MB)Data availability statement
The authors confirm that the data supporting the findings of this study are available within the article [and/or] its supplementary materials.