
Figures & data
Figure 1. RGNNV induces polarization of grouper macrophages (a) Localization of macrophages in the grouper brain as indicated by in situ hybridization. Macrophages were located on the membrane surrounding the brain marketed by Mrc1 (green). Scale bars was 100 μm. (b) Primary cultured macrophages. (c) iNOS activities in RGNNV infected and uninfected macrophages (n = 4). (d) arginase activities in RGNNV infected and uninfected macrophages. (e) mRNA levels of cytokines in primary cultured grouper macrophages, include IL-1β, TNFα, IL-10, and TGF-β (n = 4). (f) mRNA levels of cytokines in vivo, include IL-1β, TNFα, IL-10, and TGF-β (n = 5). **p < 0.01, ***p < 0.001, ****p < 0.0001.
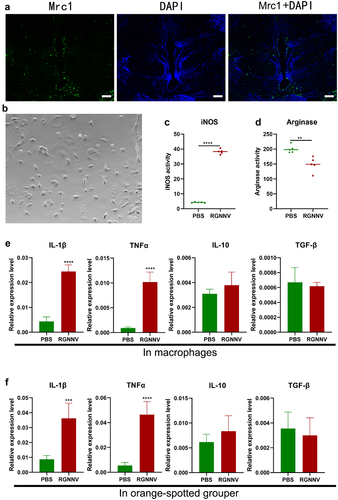
Figure 2. mRNA expression of CXCR3.2 in macrophages and brain tissues (a) mRNA expression of CXCR3s in macrophages after RGNNV challenge (n = 4). (b) mRNA expression of CXCR3s in vivo after RGNNV challenge (n = 5). (c) The expression of CXCR3.2 at 6 h, 12 h, 24 h, 36 h, and 48 h after RGNNV treatment in macrophages (n = 4). (d) protein levels of CXCR3.2 were determined by Western blotting in grouper macrophages at 6 h, 12 h, 24 h, 36 h, and 48 h following RGNNV infection. (e) The immunofluorescence shows CXCR3.2 (green) in macrophages at 6 h, 12 h, 24 h, 36 h, and 48 h after RGNNV treatment in macrophages, Scale bar, 20 μm. (f) The expression of CXCR3.2 at 6 h, 12 h, 24 h, 36 h, and 48 h after RGNNV treatment in grouper (n = 5). *p < 0.05, **p < 0.01, ***p < 0.001, ****p < 0.0001.
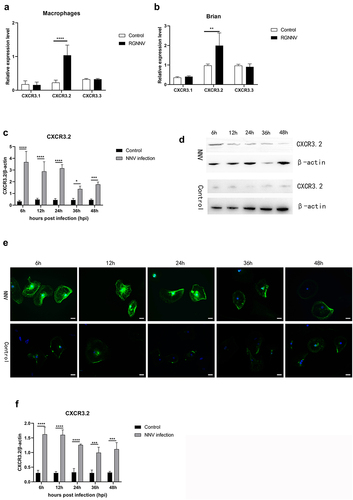
Figure 3. CXCR3.2 regulate the polarization of macrophages. (a) the expression of IL-1β and TNFα in macrophages after treated with PBS, RGNNV, and siCXCR3.2+RGNNV (n = 4). (b) the expression of IL-1β and TNFα in macrophages after treated with PBS, RGNNV, or NBI-74330+RGNNV (n = 4). (c) the expression of IL-1β and TNFα in orange-spotted grouper after treated with PBS, RGNNV, or NBI-74330+RGNNV (n = 5). (d and e) iNOS and arginase activity in macrophages after PBS, RGNNV, or NBI-74330+RGNNV treatment (n = 4). *p < 0.05, **p < 0.01, ***p < 0.001, ****p < 0.0001.
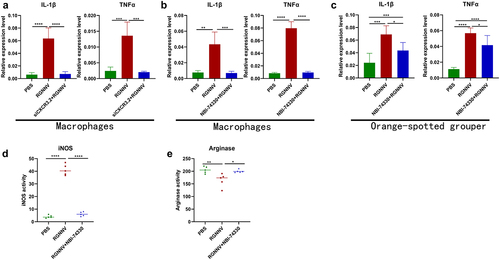
Figure 4. CXCL11s mediate macrophage chemotaxis and polarization. (a) Effect of CXCL11s on the chemotaxis ability of resting macrophages (n = 4). (b) Effect of CXCL11s on iNOS activity in resting macrophages. The macrophages were treated with 50 nM CXCL11.1 and 10 nM CXCL11.2 (n = 5). (c) Effect of CXCL11s on arginase activity in resting macrophages. The macrophages were treated with 50 nM CXCL11.1 and 10 nM CXCL11.2 (n = 5). (d and e) the expression of TNFα and IL-1β after PBS, RGNNV or siCXCL11.1+RGNNV treated macrophages (n = 4). (f and g) the expression of TNFα and IL-1β after PBS, RGNNV or siCXCL11.2+RGNNV treated macrophages (n = 4). (h and i) the expression of TNFα and IL-1β after PBS, RGNNV or siCXCL11.1+ siCXCL11.2+RGNNV treated macrophages (n = 4). *p < 0.05, **p < 0.01, ***p < 0.001, ****p < 0.0001.
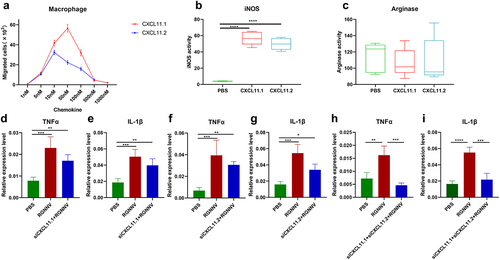
Figure 5. CXCR3.2 have effect on virus replication and brain tissue damage in fish. (a and b) the expression of virus gene (CP and RdRp) in PBS, RGNNV, and NBI-74330+RGNNV treatment grouper (n = 5). (c) Representative RGNNV fluorescent situ hybridization (FISH) staining of brain sections from fish injected with the PBS, RGNNV and NBI-74330+rgnnv (n = 3). Scale bar: 50 µm. (d) the brain histology when injected with RGNNV and RGNNV+NBI-74330. The black arrowhead indicates vacuoles. Scale bar: 25 µm. (e) Values indicate the cumulative mortality in each group of the orange-spotted groupers during the 14-day experimental period after different injection treatments (PBS, RGNNV, or RGNNV+ NBI-74330).
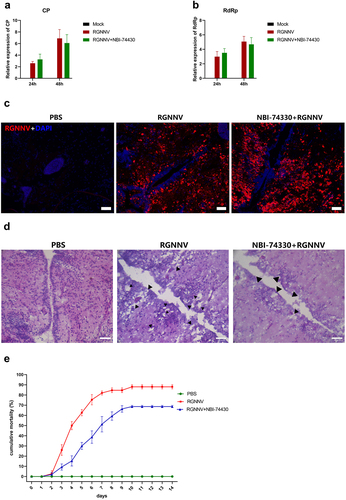
Figure 6. The supernatant of macrophages (after RGNNV infection or RGNNV+NBI-74330 treatment) affect brain polarization. (a) Protocol for collected supernatant from RGNNV-infected macrophages and added it to primary brain cells. (b and c) Expression levels of TNFα and IL-1β after PBS, RGNNV or RGNNV infection macrophages supernatant treatment primary brain cells at 4 h, 8 h, 12 h, 24 h and 48 h (n = 4). (d) iNOS activity in PBS, RGNNV or RGNNV infection macrophages supernatant treatment primary brain cells at 4 h, 8 h, 12 h, 24 h and 48 h. (e) Protocol for collected supernatant from RGNNV+NBI-74330 treatment macrophages and added it to primary brain cells. (f and g) Expression levels of TNFα and IL-1β after PBS, RGNNV or RGNNV+NBI-74330 treatment macrophages supernatant treatment primary brain cells at 4 h, 8 h, 12 h, 24 h and 48 h (n = 4). (h) iNOS activity in PBS, RGNNV or RGNNV+NBI-74330 treatment macrophages supernatant treatment primary brain cells at 4 h, 8 h, 12 h, 24 h and 48 h.
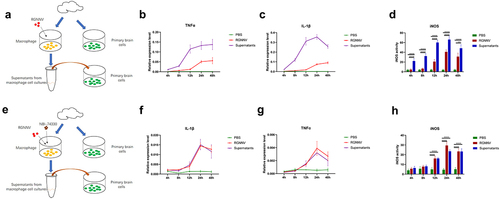
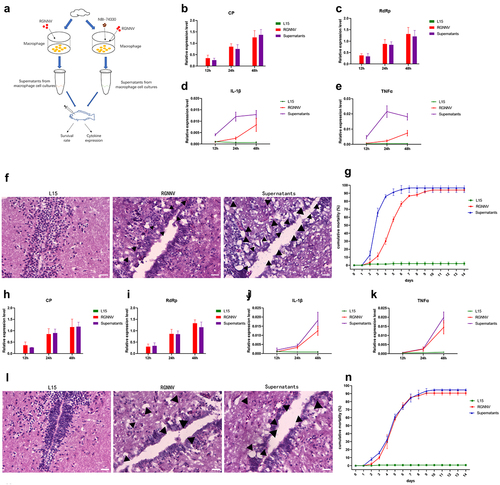
Figure 7. The supernatant of macrophages on the grouper brain in vivo. (a) Protocol for collected supernatant from RGNNV infection or RGNNV+NBI-74330 treatment macrophages and injected it to grouper. (b and c) Expression levels of virus gene CP and RdRp after L15, RGNNV or RGNNV infection macrophages supernatant treatment at 12 h, 24 h and 48 h (n = 5). (d and e) Expression levels of virus gene IL-1β and TNFα after L15, RGNNV or RGNNV infection macrophages supernatant treatment at 12 h, 24 h and 48 h (n = 5). (f) the brain histology when injected with L15, RGNNV or RGNNV infection macrophages supernatant. The black arrowhead indicates vacuoles. Scale bar: 25 µm. (g) Values indicate the cumulative mortality in each group of the orange-spotted groupers during the 14-day experimental period after different injection treatments (L15, RGNNV or RGNNV infection macrophages supernatant). (h and i) Expression levels of virus gene CP and RdRp after L15, RGNNV or RGNNV+NBI-74330 treatment macrophages supernatant treatment at 12 h, 24 h and 48 h (n = 5). (j and k) Expression levels of virus gene IL-1β and TNFα after L15, RGNNV or RGNNV+NBI-74330 macrophages treatment supernatant treatment at 12 h, 24 h and 48 h (n = 5). (l) the brain histology when injected with L15, RGNNV or RGNNV+NBI-74330 macrophages treatment supernatant. The black arrowhead indicates vacuoles. Scale bar: 25 µm. (n) Values indicate the cumulative mortality in each group of the orange-spotted groupers during the 14-day experimental period after different injection treatments (L15, RGNNV or RGNNV+NBI-74330 macrophages treatment supernatant).
Supplemental Material
Download MS Word (2.7 MB)Data availability statement
The raw data supporting the conclusions of this article will be made available by the authors without undue reservation to any qualified researcher. The raw data in DOI: 10.17632/f5gd8tsgy9.1.