
Figures & data
Figure 1. Deletion of stk1 leads to reduced production of PCN and PVD, and attenuated twitching motility.
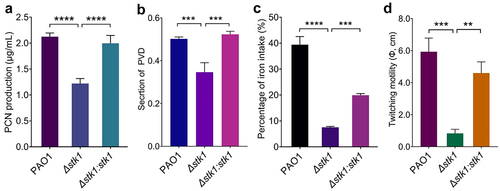
Figure 2. Effect of the deletion of stk1 on biofilm production and EPS secretion.
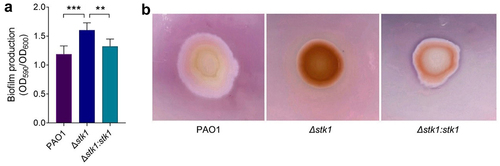
Table 1. MIC of the indicated antibiotics for the strains PAO1, Δstk1, Δstk1:stk1 and PAO1-algRS143A.
Figure 3. AlgR is a substrate of Stk1 and its Ser143 can be phosphorylated by this kinase.
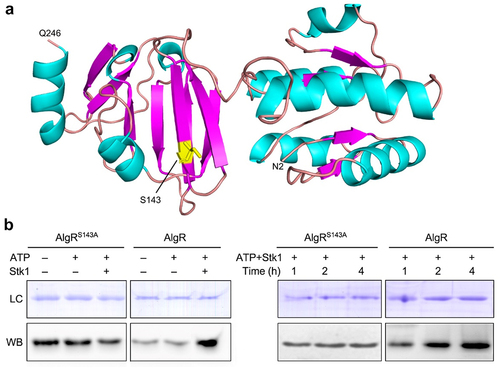
Figure 4. Both the deletion of stk1 and the mutation of algRS143A led to increased biofilm production, EPS secretion and antibiotic resistance.
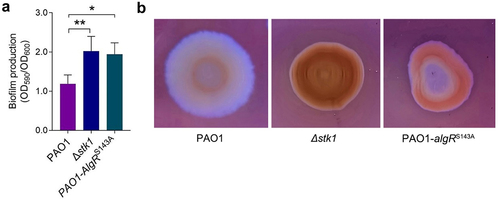
Figure 5. Deletion of stk1 and mutation of algRS143A both resulted in decreased PCN production and attenuated twitching motility.
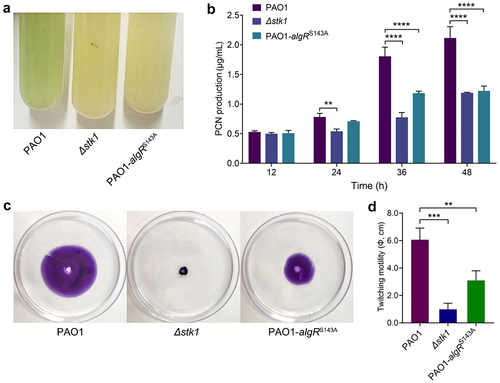
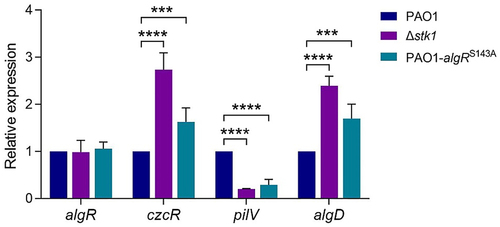
Figure 6. Determination of the relative expression of algR and several algR-regulated genes in PAO1, Δstk1 and PAO1-algRS143A by qPCR.
Supplemental Material
Download MS Word (566.7 KB)Data availability statement
The data that support the findings of this study are openly available in figshare at https://doi.org/10.6084/m9.figshare.25551474.v3, reference number 25,551,474.