
Figures & data
Table 1. Sequence of Primers.
Table 2. Details of the specific primer sequences used for qPCR experiments.
Figure 1. Schematic diagram of the immunization, challenge, and cohabitation of rabbits. Twenty rabbits were divided into five groups for immunization. Twelve rabbits were divided into three groups for challenge. The box indicates rabbits in the orally immunized KC1-VP60/L. reuteri (Dark Pink), PBS (blue), and rabbits infected with RHDV (green) were raised in the same cage.
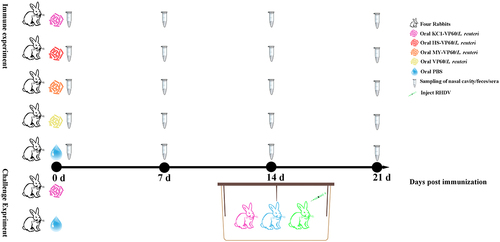
Figure 2. Typical morphology and molecular phenotype of raMoDCs(a) morphology of imraMoDCs (Day 6) and mraMoDCs (Day 7, treated with LPS for 24 h for maturation) observed through optical microscopy and scanning electron microscopy. (b) Immunostaining of imraMoDCs and mraMoDCs for MHC-II (green), CD86 (red), and nuclei stained with DAPI (blue). (c) Flow cytometry analysis showing the expression of surface markers (CD172a, MHC-II, CD86, and CD14) on imraMoDCs and mraMoDCs. (d) Flow cytometry assessment of the phagocytic ability of raMoDCs toward FITC-labeled glucans. The data reflect % abundance for positive populations. Brightness, contrast, or color balance adjustments were uniformly applied to all microscopy images.
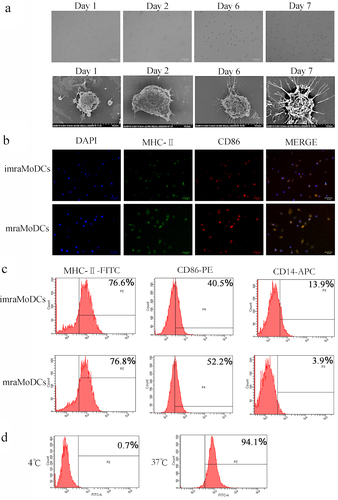
Table 3. Determination of phage recovery rate.
Figure 3. Analysis of phage binding ability to raMoDCs by ELISA. (a) Sequences of 12-mer peptides. (b) Cell-ELISA assessing the binding selectivity to raMoDCs of eight phage clones from the last round of biopanning. M13 wild-type phage without any displayed peptide served as a negative control. Data are presented as the mean ± SD of three independent experiments. Significant differences are denoted by different letters (a vs. b, a vs. c, b vs. c) at the same time point (p < 0.01).
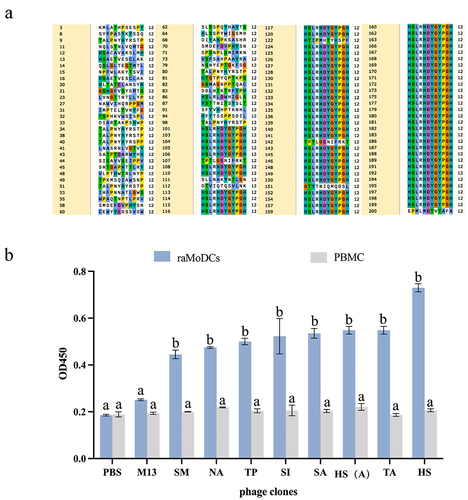
Table 4. Sequences and frequencies of peptides.
Figure 4. Binding ability of dc-targeting peptides to raMoDCs. (a) Fluorescence microscopy images showing the binding of FITC-labeled HS, KC1, MY, and negative control (NC) peptides to raMoDCs. (b) Flow cytometry analysis of the binding ability of the peptides to raMoDCs. Red indicates rabbit DCs expressing CD86, green represents FITC-labeled peptides, and blue represents nuclei stained with DAPI. Changes in brightness, contrast, or color balance were applied uniformly to all pixels in the microscopy image.
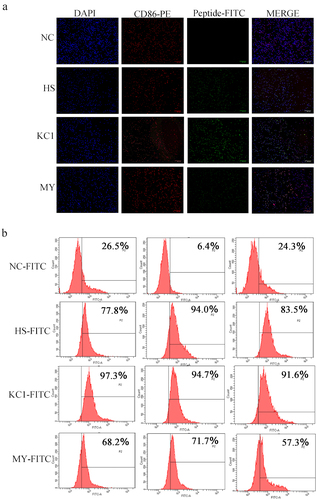
Figure 5. Characterization of expressed proteins in L. reuteri. (a) Schematic representation of the construction of recombinant plasmids: pPG-HS-VP60, pPG-KC1-VP60, pPG-MY-VP60, and pPG-VP60. (b) Verification of expressed VP60 protein in L. reuteri through western blotting. The primary antibody used was mouse anti-Flag monoclonal antibody. (c) Visualization of expressed proteins in Lactobacillus via fluorescence microscopy. The fluorescence signals confirm the presence of HS-VP60/L. reuteri, KC1-VP60/L. reuteri, and MY-VP60/L. reuteri.
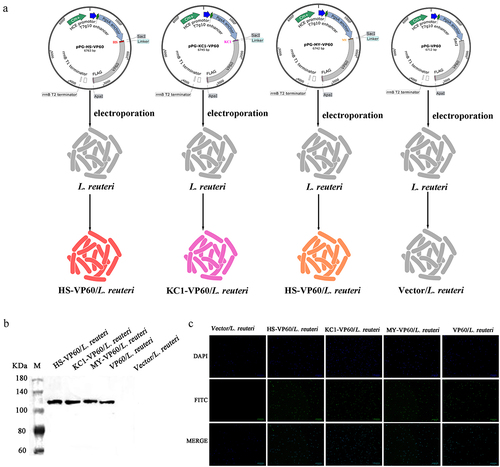
Figure 6. The ability of raMoDCs to recognize and capture recombinant Lactobacillus was evaluated using scanning electron microscopy and the analysis of toll-like receptor and cytokine mRNA levels in raMoDCs (106 cells/mL) in response to Vector/L. reuteri, VP60/L. reuteri, HS-VP60/L. reuteri, KC1-VP60/L. reuteri, MY-VP60/L. reuteri, and LPS (2 µg/mL) stimulation. (a) Scanning electron microscopy images showing the morphology of raMoDCs capturing recombinant Lactobacillus at 30, 60, 120 min. (b) Recombinant Lactobacillus-incubated raMoDCs at a ratio of 1:10 (DCs: recombinant Lactobacillus). RaMoDCs were stimulated by recombinant Lactobacillus and LPS for 12 h. Unstimulated raMoDCs were used as a control. Different letters (a vs. b, a vs. c, b vs. (c) indicate significant differences (p < 0.01) at the same time point.
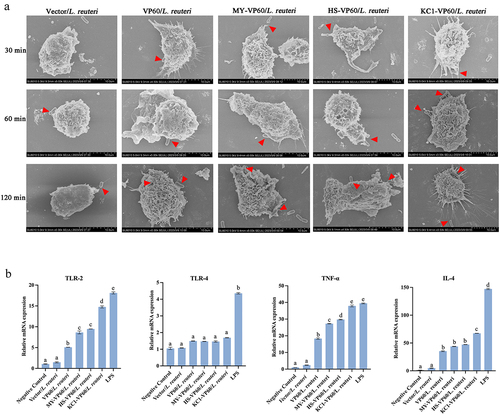
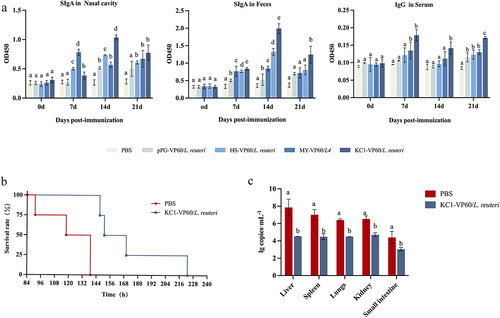
Figure 7. Detection of anti-RHDV-specific IgG/sIgA antibody levels and rabbit survival after challenge. (a) Specific anti-RHDV IgG and sIgA antibody levels in rabbits orally immunized with PBS, VP60/L. reuteri, HS-VP60/L. reuteri, KC1-VP60/L. reuteri, and MY-VP60/L. reuteri. Measurement of a specific anti-RHDV IgG antibody in the antisera from immunized rabbits by ELISA using RHDV as the coating antigen. Measurement of specific anti-RHDV SIgA antibody levels in the feces and nasal cavity by ELISA using RHDV as the coating antigen. (b) Rabbit survival after challenge. (c) RHDV load in the liver, spleen, lungs, and kidneys of infected dead rabbits. Different letters (a vs. b, a vs. c, b vs. c) indicate significant differences (p < 0.01) at the same time point.
Supplemental Material
Download PDF (290.8 KB)Data availability statement
The data that support the findings of this study are openly available in Mendeley Data at http://doi.org/10.17632/s9x7z3v6df.1