
Figures & data
Table 1. Overview of the two interventions.
Table 2. Items loading on Factor 2 with corresponding factor load.
Table 3. Overview of the participants of the two interventions. All data are based on the students’ own statements in the pre-test. Marks are reported on a scale of 1 = very good to 6 = inadequate. Interest was assessed on a four-level Likert scale (1 = low interest to 4 = high interest).
Table 4. Mean value comparison of the pre- and post-test results for trust in science.
Figure 1. Change of mean trust in science through the outreach activity according to different pre-levels of trust in science for Intervention I (High-trustors N = 63; Low-trustors N = 55).
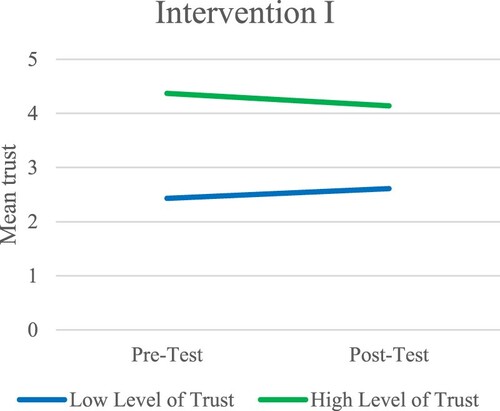
Figure 2. Change of mean trust in science through the outreach activity according to different pre-levels of trust in science for Intervention II (High-trustors N = 60; Low-trustors N = 39).
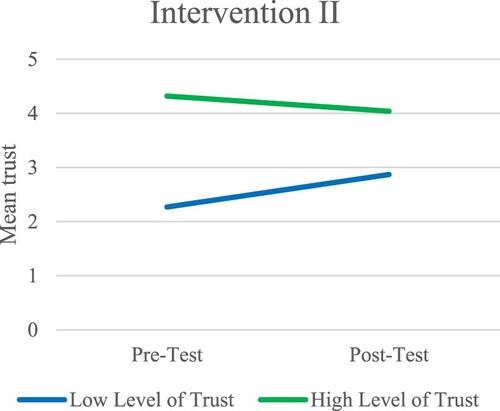
Table 5. Descriptive information of the mean trust level of high-/low-trustors in pre-/post-test.
Table 6. Learning success depending on the pre-test trust level: Mean value comparison of knowledge success between high-trustors (+1SD) and low-trustors (−1SD).