1,927
Views
17
CrossRef citations to date
0
Altmetric
Original Research

Identification of a novel human memory T-cell population with the characteristics of stem-like chemo-resistance

, , , , , , , , , , , , , , & show all
Article: e1165376 | Received 13 Jan 2016, Accepted 08 Mar 2016, Published online: 08 Jun 2016

Figures & data

Figure 1. CD8+ALDHhigh T cells in PBMC contained a population with the characteristics of drug resistance and responsibility for TCR stimulation. (A) PBMC demonstrated ALDH activity. FACS analysis of ALDH1 expression in cells and the DEAB control. (B) Proportions of CD8+ALDHhigh T cells in PBMC (n = 33) and tonsils (n = 4). Each point represents data from an individual healthy donor and patient, and bars represent mean. (C) Expansion (measured as fold increases) of ALDHhigh and ALDHlow cells in CD8+ T cells activated with bCD3/CD28 and cultured with IL-7 and IL-15 at days 6–7. Data represented mean ± SD of three independent experiments. Statistically significant differences were determined with the Mann–Whitney U test. (D) CD8+ALDHhigh T cells were resistant to adriamycin in vitro. CD8+ALDHhigh/low cells were cultured in the presence of serially diluted adriamycin and labeled with Annexin V.
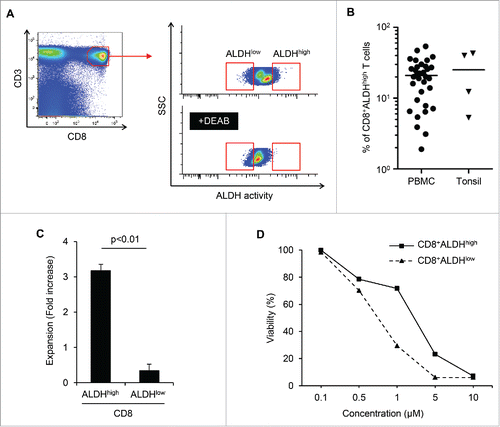
Figure 1. CD8+ALDHhigh T cells in PBMC contained a population with the characteristics of drug resistance and responsibility for TCR stimulation. (A) PBMC demonstrated ALDH activity. FACS analysis of ALDH1 expression in cells and the DEAB control. (B) Proportions of CD8+ALDHhigh T cells in PBMC (n = 33) and tonsils (n = 4). Each point represents data from an individual healthy donor and patient, and bars represent mean. (C) Expansion (measured as fold increases) of ALDHhigh and ALDHlow cells in CD8+ T cells activated with bCD3/CD28 and cultured with IL-7 and IL-15 at days 6–7. Data represented mean ± SD of three independent experiments. Statistically significant differences were determined with the Mann–Whitney U test. (D) CD8+ALDHhigh T cells were resistant to adriamycin in vitro. CD8+ALDHhigh/low cells were cultured in the presence of serially diluted adriamycin and labeled with Annexin V.

Figure 2. Identification of CD73 as a marker to represent ALDH1. (A) The mRNA expression of seven upregulated genes in two healthy donors (HDs). (B) Expression of CD73 mRNA in CD8+ALDHhigh and CD8+ALDHlow cells. Data represent mean ± SD. Statistically significant differences were determined with the Mann–Whitney U test. (C) FACS analysis of CD73-positive cells in CD8+ALDHhigh and CD8+ALDHlow cells is shown. Each point represents data from an individual healthy donor, and bars represent mean. Statistically significant differences were determined with the Mann–Whitney U test. (D) Expansion (measured as fold increases) of CD73+ and CD73 cells in CD8+ T cells activated with bCD3/CD28 and cultured with IL-7 and IL-15 at days 6–7. Data represented mean ± SD of six independent experiments. Statistically significant differences were determined with the Mann–Whitney U test. (E) The microscopic features of CD8+CD73+ and CD8+CD73 cells reacted with anti-CD3/CD28 microbeads. Data are representative of six independent experiments. (F) Expression of ABCB1 mRNA in CD8+CD73+ and CD8+CD73 cells. Data represent mean ± SD. Statistically significant differences were determined with the Mann–Whitney U test. (G) Representative FACS plots of CD45RA and CD62L expression in CD8+CD73+ and CD8+CD73 cells. (H) Proportions of CD73+ and CD73 cells in CD8+ T-cell subsets from adult PB (n = 10). Each point represents data from an individual healthy donor, and bars represent mean. Statistically significant differences were determined with the Mann–Whitney U test. (I) CD8+73+ and CD8+CD73 cells were activated with bCD3/CD28 and cultured with IL-7 and IL-15 for 6–7 d, and then analyzed for expression of CD45RA and CD62L by flow cytometry (left panel). Cell numbers of CD8+ T-cell subsets generated from CD8+73+ and CD8+CD73 cells stimulated with bCD3/CD28, IL-7 and IL-15 (right panel). Data are representative of three independent experiments.
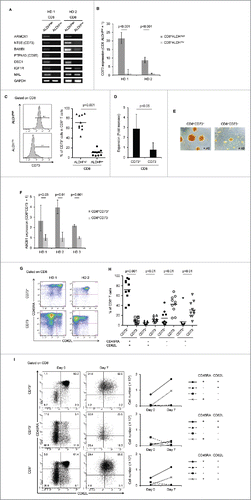
Figure 2. Identification of CD73 as a marker to represent ALDH1. (A) The mRNA expression of seven upregulated genes in two healthy donors (HDs). (B) Expression of CD73 mRNA in CD8+ALDHhigh and CD8+ALDHlow cells. Data represent mean ± SD. Statistically significant differences were determined with the Mann–Whitney U test. (C) FACS analysis of CD73-positive cells in CD8+ALDHhigh and CD8+ALDHlow cells is shown. Each point represents data from an individual healthy donor, and bars represent mean. Statistically significant differences were determined with the Mann–Whitney U test. (D) Expansion (measured as fold increases) of CD73+ and CD73− cells in CD8+ T cells activated with bCD3/CD28 and cultured with IL-7 and IL-15 at days 6–7. Data represented mean ± SD of six independent experiments. Statistically significant differences were determined with the Mann–Whitney U test. (E) The microscopic features of CD8+CD73+ and CD8+CD73− cells reacted with anti-CD3/CD28 microbeads. Data are representative of six independent experiments. (F) Expression of ABCB1 mRNA in CD8+CD73+ and CD8+CD73− cells. Data represent mean ± SD. Statistically significant differences were determined with the Mann–Whitney U test. (G) Representative FACS plots of CD45RA and CD62L expression in CD8+CD73+ and CD8+CD73− cells. (H) Proportions of CD73+ and CD73− cells in CD8+ T-cell subsets from adult PB (n = 10). Each point represents data from an individual healthy donor, and bars represent mean. Statistically significant differences were determined with the Mann–Whitney U test. (I) CD8+73+ and CD8+CD73− cells were activated with bCD3/CD28 and cultured with IL-7 and IL-15 for 6–7 d, and then analyzed for expression of CD45RA and CD62L by flow cytometry (left panel). Cell numbers of CD8+ T-cell subsets generated from CD8+73+ and CD8+CD73− cells stimulated with bCD3/CD28, IL-7 and IL-15 (right panel). Data are representative of three independent experiments.

Figure 3. CD8+CD73+CD45RA+CD62L+ cells contains a memory cell population. (A) CD8+CD73 cells, CD8+CD73CD45RA+CD62L+ cells, and CD8+CD73+CD45RA+CD62L+ cells were stimulated with viral peptide-pulsed CD8 T cells and cultured for 12–14 d in the presence of IL-2 and IL-7. The percentage of tetramer+ events is shown. Data are representative of six independent experiments. (B) Expansion (measured as fold increases) of CD73+ and CD73 cells in CD8+CD45RA+CD62L+ T cells activated with bCD3/CD28 and cultured with IL-7 and IL-15 at days 6–7. Data represented mean ± SD of four independent experiments. Statistically significant differences were determined with the Mann–Whitney U test. (C) CD8+CD73+CD45RA+CD62L+ and CD8+CD73CD45RA+CD62L+ cells were activated with bCD3/CD28 and cultured with IL-7 and IL-15 for 6–7 d, and then analyzed for expression of CD45RA and CD62L by flow cytometry (left panel). Cell numbers of CD8+ T-cell subsets generated from CD8+CD73+CD45RA+CD62L+ and CD8+CD73CD45RA+CD62L+ cells stimulated with bCD3/CD28, IL-7 and IL-15 (right panel). Data are representative of four independent experiments. (D) The mRNA expression of cytokine genes in CD8+CD73+CD45RA+CD62L+ T cells and CD8+CD73CD45RA+CD62L+ T cells.

Figure 3. CD8+CD73+CD45RA+CD62L+ cells contains a memory cell population. (A) CD8+CD73− cells, CD8+CD73−CD45RA+CD62L+ cells, and CD8+CD73+CD45RA+CD62L+ cells were stimulated with viral peptide-pulsed CD8− T cells and cultured for 12–14 d in the presence of IL-2 and IL-7. The percentage of tetramer+ events is shown. Data are representative of six independent experiments. (B) Expansion (measured as fold increases) of CD73+ and CD73− cells in CD8+CD45RA+CD62L+ T cells activated with bCD3/CD28 and cultured with IL-7 and IL-15 at days 6–7. Data represented mean ± SD of four independent experiments. Statistically significant differences were determined with the Mann–Whitney U test. (C) CD8+CD73+CD45RA+CD62L+ and CD8+CD73−CD45RA+CD62L+ cells were activated with bCD3/CD28 and cultured with IL-7 and IL-15 for 6–7 d, and then analyzed for expression of CD45RA and CD62L by flow cytometry (left panel). Cell numbers of CD8+ T-cell subsets generated from CD8+CD73+CD45RA+CD62L+ and CD8+CD73−CD45RA+CD62L+ cells stimulated with bCD3/CD28, IL-7 and IL-15 (right panel). Data are representative of four independent experiments. (D) The mRNA expression of cytokine genes in CD8+CD73+CD45RA+CD62L+ T cells and CD8+CD73−CD45RA+CD62L+ T cells.
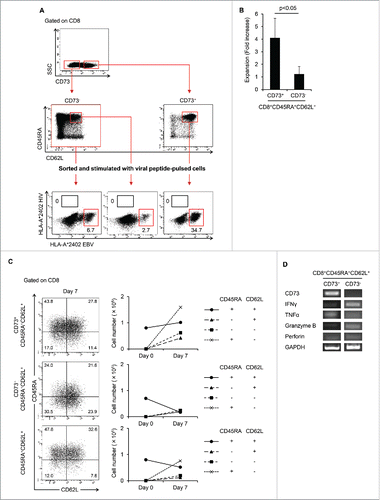
Figure 4. CXCR3 divided CD8+CD73+CD45RA+CD62L+ cells into pure naive and novel memory phenotypes. (A) Representative FACS plots of CD73 expression on CD8+ T cells in cord blood (CB) and adult peripheral blood (PB). (B) Proportion of CD8+ T cells expressing CD73 in cord blood and adult peripheral blood. Each point represents data from an individual healthy donor, and bars represent mean. Statistically significant differences were determined with the Mann–Whitney U test. (C) Representative FACS plots of CD45RA and CD62L expression in CD8+CD73+ cells on cord blood and adult peripheral blood cells. Data are representative of three independent experiments (CB) and ten independent experiments (PB). (D) Representative FACS plots of CXCR3 expression on CD8+CD73+CD45RA+CD62L+ T cells in cord blood and adult peripheral blood. (E) Proportion of CD8+CD73+CD45RA+CD62L+ T cells expressing CXCR3 in cord blood and adult peripheral blood. Each point represents data from an individual healthy donor, and bars represent mean. Statistically significant differences were determined with the Mann–Whitney U test.
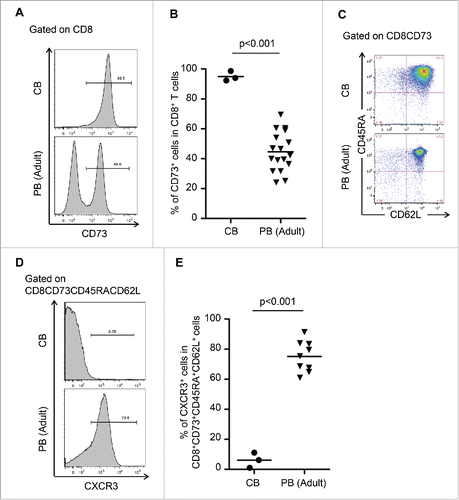
Figure 4. CXCR3 divided CD8+CD73+CD45RA+CD62L+ cells into pure naive and novel memory phenotypes. (A) Representative FACS plots of CD73 expression on CD8+ T cells in cord blood (CB) and adult peripheral blood (PB). (B) Proportion of CD8+ T cells expressing CD73 in cord blood and adult peripheral blood. Each point represents data from an individual healthy donor, and bars represent mean. Statistically significant differences were determined with the Mann–Whitney U test. (C) Representative FACS plots of CD45RA and CD62L expression in CD8+CD73+ cells on cord blood and adult peripheral blood cells. Data are representative of three independent experiments (CB) and ten independent experiments (PB). (D) Representative FACS plots of CXCR3 expression on CD8+CD73+CD45RA+CD62L+ T cells in cord blood and adult peripheral blood. (E) Proportion of CD8+CD73+CD45RA+CD62L+ T cells expressing CXCR3 in cord blood and adult peripheral blood. Each point represents data from an individual healthy donor, and bars represent mean. Statistically significant differences were determined with the Mann–Whitney U test.

Figure 5. Identification of a novel memory T cell population; young memory T cells (TYM).(A) Percentages of CD8+ T cell subsets in adult peripheral blood (n=10). Each point represents data from an individual healthy donor, and bars represent mean.(B) CD8+CD73+CD45RA+CD62L+CXCR3+ T cells and known memory CD8+ T cell subsets were cultured in the presence of serially diluted Adriamycin (left) and carboplatin (right), and labeled with Annexin V.(C) Expression of ABCB1 mRNA in CD8+CD73+CD45RA+CD62L+CXCR3+ T cells and known memory CD8+ T cell subsets. Bars represent mean ± SEM. Data represent mean ± SD. Statistically significant differences were determined with the Mann–Whitney U test.(D) The mRNA expression of cytokine genes in CD8+ T cell subsets.(E) Expansion of CD8+CD73+CD45RA+CD62L+CXCR3+ T cells and known memory CD8+ T cell subsets activated with bCD3/CD28 and cultured with IL-7 and IL-15 at days 6-7. Data represented mean ± SD of five independent experiments. Statistically significant differences were determined with the Mann–Whitney U test.(F) Differentiation of T cells upon TCR stimulation using bCD3/CD28, IL-7 and IL-15 at Day 7. Data are representative of three independent experiments.(G) CD8+CD73- T cells, CD8+CD73+CD45RA+CD62L+CXCR3- T cells and CD8+CD73+CD45RA+CD62L+CXCR3+ T cells were stimulated with CD8- T cells pulsed with epitopes from EBV and HIV, and cultured for 12-14 days in the presence of IL-2 and IL-7. The percentage of tetramer+ events is shown. Data are representative of six independent experiments.(H) Detection of CD107a exposed on the cell surface after antigen stimulation. HLA-A*24:02 restricted CTL were stimulated using an epitope peptide in the presence of an FITC-labeled CD107a monoclonal antibody and cultured for 5 hours at 37°C. After culture, the cells were stained with HLA-A*24:02 EBV tetramer-PE.(I) CD8+CD73+CD45RA+CD62L+CXCR3+ T cells were stimulated with CD8- T cells pulsed with epitopes from PBF or survivin-2B, and cultured for 12-14 days in the presence of IL-2 and IL-7. The percentage of tetramer+ events is shown.
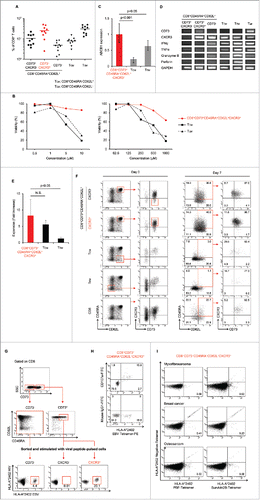
Figure 5. Identification of a novel memory T cell population; young memory T cells (TYM).(A) Percentages of CD8+ T cell subsets in adult peripheral blood (n=10). Each point represents data from an individual healthy donor, and bars represent mean.(B) CD8+CD73+CD45RA+CD62L+CXCR3+ T cells and known memory CD8+ T cell subsets were cultured in the presence of serially diluted Adriamycin (left) and carboplatin (right), and labeled with Annexin V.(C) Expression of ABCB1 mRNA in CD8+CD73+CD45RA+CD62L+CXCR3+ T cells and known memory CD8+ T cell subsets. Bars represent mean ± SEM. Data represent mean ± SD. Statistically significant differences were determined with the Mann–Whitney U test.(D) The mRNA expression of cytokine genes in CD8+ T cell subsets.(E) Expansion of CD8+CD73+CD45RA+CD62L+CXCR3+ T cells and known memory CD8+ T cell subsets activated with bCD3/CD28 and cultured with IL-7 and IL-15 at days 6-7. Data represented mean ± SD of five independent experiments. Statistically significant differences were determined with the Mann–Whitney U test.(F) Differentiation of T cells upon TCR stimulation using bCD3/CD28, IL-7 and IL-15 at Day 7. Data are representative of three independent experiments.(G) CD8+CD73- T cells, CD8+CD73+CD45RA+CD62L+CXCR3- T cells and CD8+CD73+CD45RA+CD62L+CXCR3+ T cells were stimulated with CD8- T cells pulsed with epitopes from EBV and HIV, and cultured for 12-14 days in the presence of IL-2 and IL-7. The percentage of tetramer+ events is shown. Data are representative of six independent experiments.(H) Detection of CD107a exposed on the cell surface after antigen stimulation. HLA-A*24:02 restricted CTL were stimulated using an epitope peptide in the presence of an FITC-labeled CD107a monoclonal antibody and cultured for 5 hours at 37°C. After culture, the cells were stained with HLA-A*24:02 EBV tetramer-PE.(I) CD8+CD73+CD45RA+CD62L+CXCR3+ T cells were stimulated with CD8- T cells pulsed with epitopes from PBF or survivin-2B, and cultured for 12-14 days in the presence of IL-2 and IL-7. The percentage of tetramer+ events is shown.
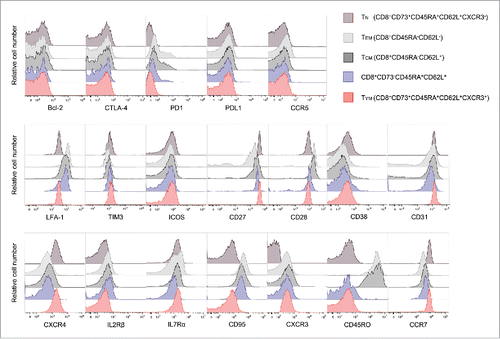
Figure 6. TYM cells are a novel memory population close to the pure naive phenotype. Flow cytometric analysis of expression of cell surface molecules. Overlaid histogram plots show expression levels of the given molecules in CD8+ T-cell subsets.

Figure 6. TYM cells are a novel memory population close to the pure naive phenotype. Flow cytometric analysis of expression of cell surface molecules. Overlaid histogram plots show expression levels of the given molecules in CD8+ T-cell subsets.
Supplemental material

KONI_A_1165376_supplemental_material.zip

Download Zip (3 MB)