863
Views
5
CrossRef citations to date
0
Altmetric
Original Research

Ligand–receptor dissociated expression explains high TSLP without prognostic impact in human primary head and neck squamous cell carcinoma

, , , , , , , , , , , , , , , , , , , , , , , & show all
Article: e1179414 | Received 22 Jan 2016, Accepted 11 Apr 2016, Published online: 13 Jul 2016

Figures & data

Figure 1. TSLP is highly expressed by epithelial cancer cells in HNSCC. Frozen section of (A) skin lesions of atopic dermatitis and (B) tumor or juxta-tumor samples from 89 patients with primary HNSCC by means of immunohistology for TSLP (brown staining). (C) Percentage of TSLP-positive samples. (D–F) Percentages of TSLP staining in epithelial cells are shown for all patients. (D) Percent of epithelial cells positive for TSLP. Each symbol represents a different sample. (E) Percent of epithelial cancer cells positive for TSLP according to the location of the tumor. (F) Percent of epithelial cells positive for TSLP between tumors and juxta-tumors in each location. Horizontal bars indicate the median. n = 89 tumors and n = 52 corresponding juxta-tumors. p value is significant if p < 0.05.
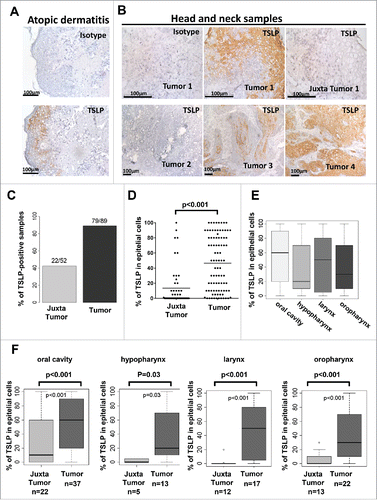
Figure 1. TSLP is highly expressed by epithelial cancer cells in HNSCC. Frozen section of (A) skin lesions of atopic dermatitis and (B) tumor or juxta-tumor samples from 89 patients with primary HNSCC by means of immunohistology for TSLP (brown staining). (C) Percentage of TSLP-positive samples. (D–F) Percentages of TSLP staining in epithelial cells are shown for all patients. (D) Percent of epithelial cells positive for TSLP. Each symbol represents a different sample. (E) Percent of epithelial cancer cells positive for TSLP according to the location of the tumor. (F) Percent of epithelial cells positive for TSLP between tumors and juxta-tumors in each location. Horizontal bars indicate the median. n = 89 tumors and n = 52 corresponding juxta-tumors. p value is significant if p < 0.05.

Figure 2. TSLP expression is associated with high differentiation status of HNSCC tumors. (A) Frozen sections of tumors or juxta-tumors samples were stained for DAPI, cytokeratin (KL1), and TSLP by immunofluorescence. (B) Bar plot representation of the percentage of TSLP expression, quantified by immunohistology, in epithelial cancer cells according to the differentiation status of the tumors. Horizontal bars indicate the median. p value is significant if p < 0.05.
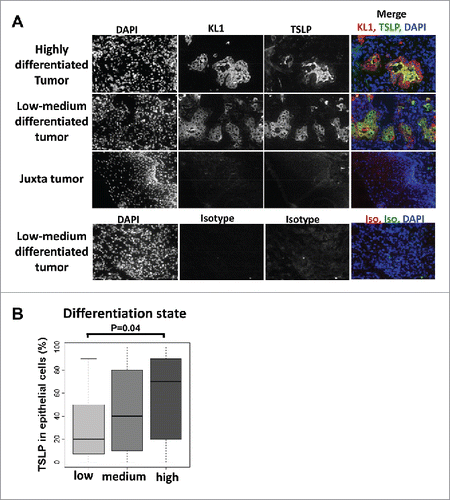
Figure 2. TSLP expression is associated with high differentiation status of HNSCC tumors. (A) Frozen sections of tumors or juxta-tumors samples were stained for DAPI, cytokeratin (KL1), and TSLP by immunofluorescence. (B) Bar plot representation of the percentage of TSLP expression, quantified by immunohistology, in epithelial cancer cells according to the differentiation status of the tumors. Horizontal bars indicate the median. p value is significant if p < 0.05.

Table 1. Correlation between tumor-TSLP expression and clinical characteristics.

Table 2. Correlation between TSLP and clinical characteristics, and clinical outcome. Log-Rank test was calculated. p value is significant if p < 0.05. RR = relative risk.

Figure 3. TSLP overexpression does not influence clinical outcome of HNSCC patients. Kaplan–Meier graph of (A) overall survival and (B) recurrence free survival according to TSLP expression by the tumors. Tumors were separated into two groups: TSLPhigh (>50% positivity) and TSLPlow (<50% positivity). Log-Rank test was calculated. p value is significant if p < 0.05.
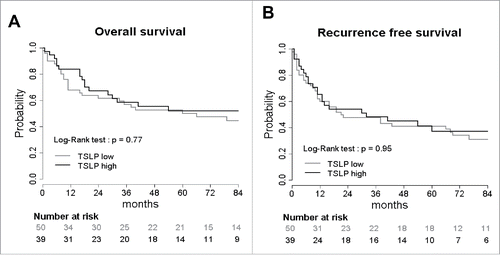
Figure 3. TSLP overexpression does not influence clinical outcome of HNSCC patients. Kaplan–Meier graph of (A) overall survival and (B) recurrence free survival according to TSLP expression by the tumors. Tumors were separated into two groups: TSLPhigh (>50% positivity) and TSLPlow (<50% positivity). Log-Rank test was calculated. p value is significant if p < 0.05.

Figure 4. Mature DCLAMP+ DC infiltrate HNSCC tumors whatever the tumor-TSLP expression level Frozen section of (A) Tonsils and HNSCC tumor by means of immunohistology for DCLAMP (brown staining). DCLAMP+-cells were counted both (B) in the epithelium and (C) in the stroma of tumor tissues and compared with corresponding percentage of TSLP expression. Each symbol represents a different sample. Pearson correlation was calculated. Linear regression was added (black lines).
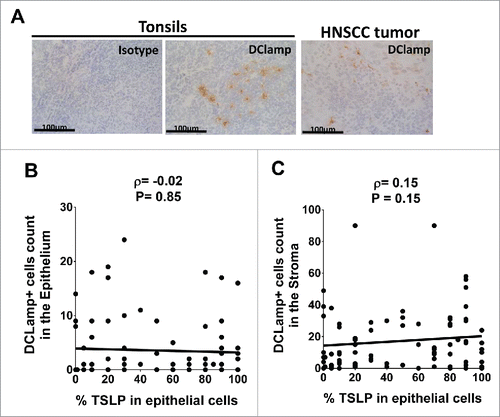
Figure 4. Mature DCLAMP+ DC infiltrate HNSCC tumors whatever the tumor-TSLP expression level Frozen section of (A) Tonsils and HNSCC tumor by means of immunohistology for DCLAMP (brown staining). DCLAMP+-cells were counted both (B) in the epithelium and (C) in the stroma of tumor tissues and compared with corresponding percentage of TSLP expression. Each symbol represents a different sample. Pearson correlation was calculated. Linear regression was added (black lines).

Figure 5. Rare tumor-infiltrating DC express TSLPR heterodimer and soluble tumor microenvironment activates DC independently of TSLP. (A) Representative IL-7Rα and TSLPR chains flow cytometry analysis of cell suspensions from digested healthy tonsils or tumor tissues or Ba/F3 cell lines. Isotype control antibodies, gray curves. Staining antibodies, black curves. (B) Specific mean fluorescence intensity (MFI) for each chain and percentage of TSLPR+/IL7Ralpha+ cells. Each symbol represents a different sample. Horizontal bars indicate the median. n = 4 independent experiments at least. (C–E) Freshly isolated blood CD11c+-DC from healthy donors were cultured 24 h without or with soluble tumor microenvironment or with exogenous rhTSLP. (C) Representative CD86 expression assessed by flow cytometry. Isotype control antibodies, gray curves. Staining antiboby, black curves. (D) CD86 MFI level. n = 3 independent experiments with six different blood DC donors and six different soluble tumor supernatants. (E) Percentage of viable (DAPI-negative) cells, specific MFI of CD80 and CD86. Specific MFI (SpeMFI) was measured on DAPI cells, by subtracting the MFI of isotype staining from the MFI of Ab staining. n = 4 independent experiments with at least eight different blood DC donors and eight different soluble tumor supernatants. Horizontal bars indicate the median. Statistical significance is indicated for pairwise comparison of culture condition groups. Paired Student t test. *p < .05; **p < 0.01. Ns = non-significant.
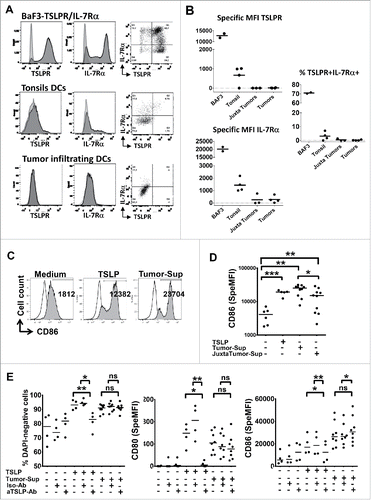
Figure 5. Rare tumor-infiltrating DC express TSLPR heterodimer and soluble tumor microenvironment activates DC independently of TSLP. (A) Representative IL-7Rα and TSLPR chains flow cytometry analysis of cell suspensions from digested healthy tonsils or tumor tissues or Ba/F3 cell lines. Isotype control antibodies, gray curves. Staining antibodies, black curves. (B) Specific mean fluorescence intensity (MFI) for each chain and percentage of TSLPR+/IL7Ralpha+ cells. Each symbol represents a different sample. Horizontal bars indicate the median. n = 4 independent experiments at least. (C–E) Freshly isolated blood CD11c+-DC from healthy donors were cultured 24 h without or with soluble tumor microenvironment or with exogenous rhTSLP. (C) Representative CD86 expression assessed by flow cytometry. Isotype control antibodies, gray curves. Staining antiboby, black curves. (D) CD86 MFI level. n = 3 independent experiments with six different blood DC donors and six different soluble tumor supernatants. (E) Percentage of viable (DAPI-negative) cells, specific MFI of CD80 and CD86. Specific MFI (SpeMFI) was measured on DAPI− cells, by subtracting the MFI of isotype staining from the MFI of Ab staining. n = 4 independent experiments with at least eight different blood DC donors and eight different soluble tumor supernatants. Horizontal bars indicate the median. Statistical significance is indicated for pairwise comparison of culture condition groups. Paired Student t test. *p < .05; **p < 0.01. Ns = non-significant.
Supplemental material

KONI_A_1179414_s02.zip

Download Zip (546.9 KB)

Reprints and Corporate Permissions

Please note: Selecting permissions does not provide access to the full text of the article, please see our help page How do I view content?

To request a reprint or corporate permissions for this article, please click on the relevant link below:

Academic Permissions

Please note: Selecting permissions does not provide access to the full text of the article, please see our help page How do I view content?

Obtain permissions instantly via Rightslink by clicking on the button below:

If you are unable to obtain permissions via Rightslink, please complete and submit this Permissions form. For more information, please visit our Permissions help page.