Figures & data
Figure 1. Effects of LPS and SCF on galectin-9 protein expression in THP-1 cells and PHL (abbreviated as PL in the figure). Cells were treated for 4 h with the indicated concentrations of LPS and SCF, then harvested and galectin-9 protein expression levels were analyzed by Western blot as outlined in Materials and Methods. Images are from one experiment representatives of three which gave similar results. Human recombinant galectin-9 (R&D Systems) was used as a positive control. Data are mean values ± SEM of three independent experiments; *p < 0.05; **p < 0.01 vs. control.
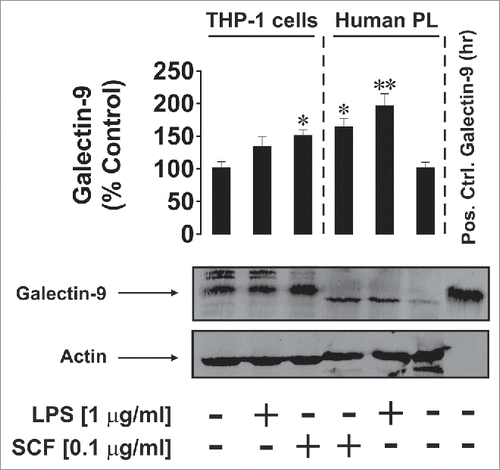
Figure 2. Galectin-9 and Tim-3 form a stable complex. Lysates obtained from 300,000 THP-1 cells or 1,500,000 PHL (abbreviated as PL in the figure; expression levels of both proteins were ca. 5 times lower in PHL compared to THP-1) were loaded onto an ELISA plate pre-coated with rabbit anti-galectin-9 antibody as described in Materials and Methods). Following incubation, captured proteins were extracted and subjected to Western blot analysis (see Materials and Methods for details). Both Tim-3 (using mouse anti-Tim-3 antibody) and galectin-9 (using rabbit anti-galectin-9 antibody) were stained. Images are from one experiment representative of four which gave similar results.
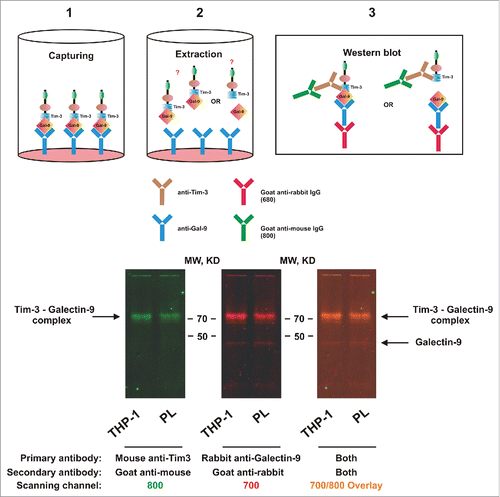
Figure 3. Comparative analysis of total and surface-based Tim-3 and galectin-9 proteins in human myeloid leukemia cell lines, PHL, and primary human AML cells. The indicated numbers of resting U-937 and THP-1 cells, PHL and primary human AML cells (AML-PB001F) were subjected to in-cell assay (ICA, detecting surface proteins) or in-cell Western (ICW, total protein detection) analysis as described in Materials and Methods. Images are from one experiment representative of five which gave similar results. Data are mean values ± SEM of five independent experiments; *p < 0.05; **p < 0.01 vs. control.
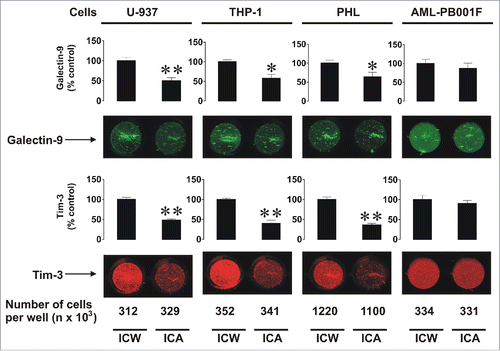
Figure 4. The effects of galectin-9 knockdown on Tim-3 expression and the mTOR pathway. Non-treated normal (wild type) and galectin-9 knockdown U-937 cells, as well as those which underwent 4 h treatment with 2 µg/mL anti-Tim-3 stimulatory antibodies, were analyzed for Tim-3 and galectin-9 levels, galectin-9 release (A), pS2448 mTOR intracellular levels, glycolysis, MGO, and VEGF secretion (B). Images are from one experiment representative of three which gave similar results. Data are mean values ± SEM of 3–5 independent experiments; *p < 0.05; **p < 0.01 vs. control; a p < 0.05; aap < 0.01 vs. anti-Tim-3.
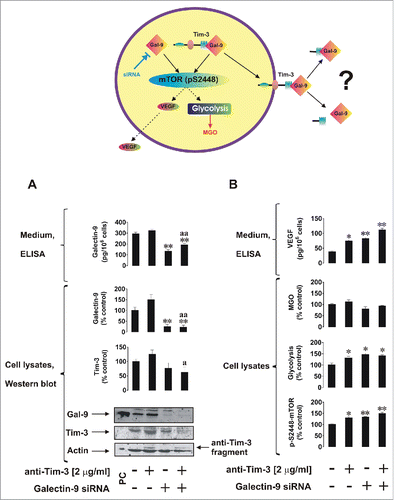
Figure 5. Tim-3 is required for galectin-9 secretion in human myeloid leukemia cells. Non-treated normal (wild type), Tim-3 knockdown and transfected with random siRNA U-937 cells, as well as the same cells which underwent 4 h treatment with 2 µg/mL anti-Tim-3, were subjected to analysis for Tim-3 and galectin-9 levels, galectin-9 release (A), pS2448 mTOR intracellular levels, glycolysis, MGO, and VEGF secretion (B). Images are from one experiment representative of three which gave similar results. Data are mean values ± SEM of 3–5 independent experiments; *p < 0.05; **p < 0.01 vs. control; ap < 0.05; aap < 0.01 vs. anti-Tim-3; bp < 0.05; bbp < 0.01 vs. random siRNA.
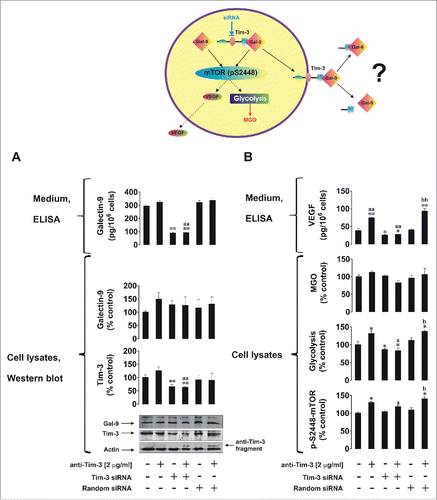
Figure 6. Galectin-9 and Tim-3 levels in primary human AML, CLL, and PHL cells as well as in blood plasma. (A) Non treated primary human AML and CLL cells, as well as those exposed for 4 h to anti-Tim-3, were precipitated and medium was subjected to measurement of galectin-9 by ELISA. Data represent mean values ± SEM of three independent experiments; *p < 0.05 vs. control. (B) PHL, primary human AML, and CLL cells were subjected to Western blot analysis for Tim-3. Images are from one experiment representative of four which gave similar results. Data are mean values ± SEM of four independent experiments. (C) Blood plasma of six healthy donors was subjected to ELISA assays for galectin-9, soluble Tim-3, and Tim-3-galectin-9 complex (for details, please see Materials and Methods and diagrams underneath the table). Data are mean values ± SEM of 3–5 independent experiments.
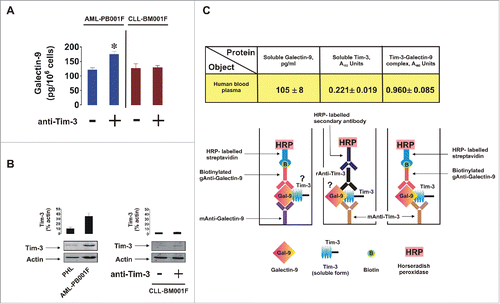
Figure 7. Tim-3-dependent secretion of galectin-9 in human AML cells could potentially impair the anti-leukemic activity of cytotoxic T cells and NK cells.
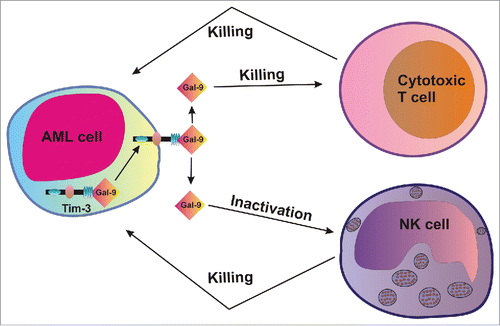
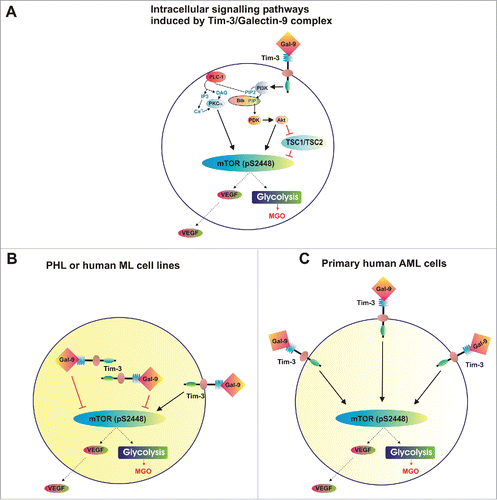
Figure 8. Distribution of complexes and corresponding effects of Tim-3 and galectin-9 in healthy and malignant human white blood cells. (A) Scheme demonstrating intracellular signaling pathways induced by Tim-3-galectin-9 complexes. (B) Tim-3/galectin-9 distribution and corresponding effects in PHL and human myeloid leukemia cell lines (THP-1 and U-937). (C) Tim-3/galectin-9 distribution and corresponding effects in primary human AML cells.