Figures & data
Figure 1. Effects of Ala on the viability of HepG2 cells. (A) Chemical structure of Ala. (B) Morphological changes of HepG2 cells were observed under a phase contrast microscope after treatment with different concentrations of Ala for 24 h. (C) and (D) HepG2 cells were treated with indicated concentrations of Ala for 24 h, and the viability was estimated by CCK-8 and RTCA assay, respectively. ***p < .001 and ****p < .0001 as compared to the control group.
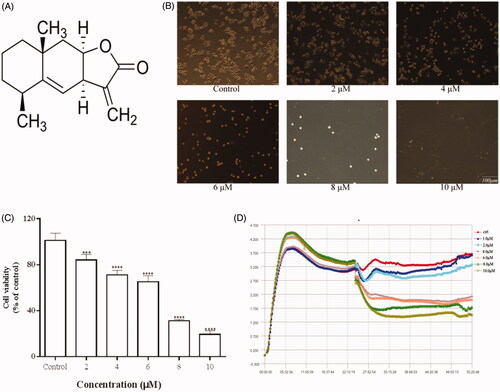
Figure 2. Ala induced G2/M phase arrest in HepG2 cell line. (A) HepG2 cells were treated with 0, 4, 6 and 8 μM of Ala for 24 h. Subsequently, the relative number of cells in each cell cycle was determined by flow cytometry. The experiment was repeated three times, and the representative results are presented. **p < .01 and ***p < .001 as compared to the control group (B) HepG2 cells were treated with 0, 4, 6 and 8 μM of Ala for 24 h, and the protein expression of cyclin A1, Cycle B1 and p21 was detected by western blot with β-actin as internal control.
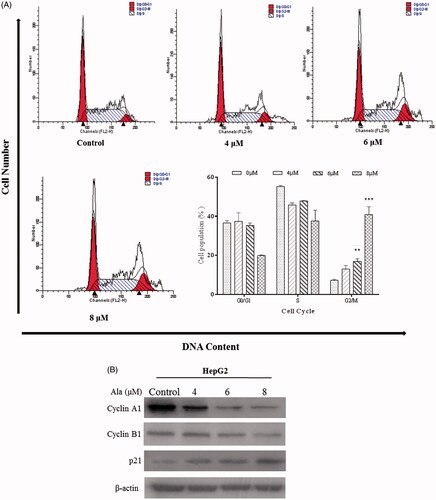
Figure 3. Ala-induced apoptosis in HepG2 cells. (A) DAPI staining was used to determine the nuclear morphological alterations of HepG2 cells (scale bar, 100 μm). (B) HepG2 cells were treated with 0, 4, 6 and 8 μM of Ala for 24 h. Ala-induced apoptosis in HepG2 cells was analyzed by V-FITC/PI staining and flow cytometry. The results were representative of three independent experiments having similar results. ****p < .0001 as compared to the control group. (C) The protein expression of Caspase-3 and PARP cleavage was detected by western blot after treatment with 0, 4, 6 and 8 μM of Ala, with β-actin as internal control.
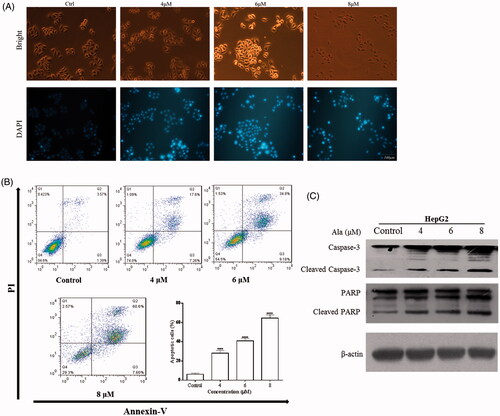
Figure 4. Ala induced apoptosis via ROS in HepG2 cell line. (A) Levels of intracellular ROS. HepG2 cells were treated with 0, 4, 6 and 8 μM of Ala for 24 h. ROS were determined with fluorescence dye DCFH-DA by flow cytometry. The results were representative of three independent experiments having similar results. ****p < .001 as compared to the control group. (B) and (C) The cells were pre-incubated with NAC (10 mM) for 1 h and then 6 μM of Ala was added to the cells for 24 h. Flow cytometry and CCK-8 were used to assess the change of apoptosis and cell viability in HepG2 cells. The results were representative of three independent experiments having similar results. **p < .01 and ****p < .001 as compared to Ala treatment alone. (D) The cells were pre-incubated with NAC (10 mM) for 1 h and then treated with 6 μM of Ala for 24 h. The expression of apoptosis-related proteins caspase-3 and PARP cleavage were analyzed by western blot with β-actin as internal control.
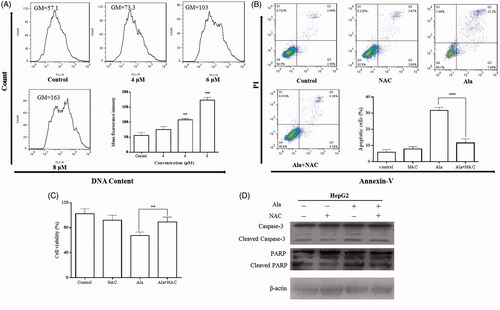
Figure 5. Ala inhibited AKT signalling pathway through ROS generation. (A) The protein expression of p-AKT and AKT was detected by western blot after treatment with 0, 4, 6 and 8 μM of Ala. (B) The cells were pre-incubated with NAC (10 mM) for 1 h and then treated with 6 μM of Ala for 24 h. The expression of p-AKT and AKT protein was analyzed by western blot with AKT as internal control.
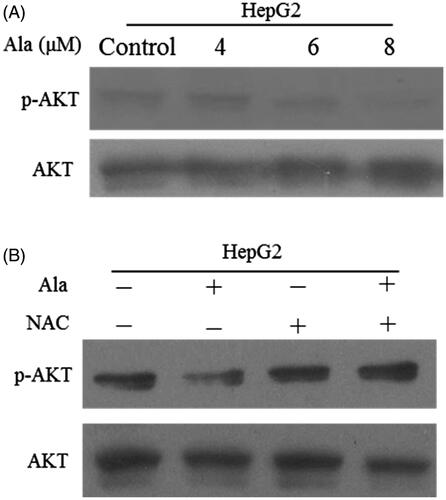
Figure 6. Mitophagy inhibition enhanced Ala-induced apoptosis in HepG2 cells. (A) The protein expression of PINK1 and Parkin was detected by western blot after treatment with 0, 4, 6 and 8 μM of Ala. (B) Ala-inhibited mitophagy was detected by MitoTracker and LysoTracker in HepG2 cells, and analyzed by laser confocal microscope. (C) The cells were pre-treated with 10 mM Mdivi-1 for 1 h and then stimulated with 6 μM of Ala for 24 h. The annexin-V-FITC/PI stained cells were evaluated by flow cytometry. (D) Pre-incubated with Mdivi-1 (10 mM) for 1 h, HepG2 cells following treatment with 6 μM Ala for 24 h. CCK-8 assay was used to assess the viability of HepG2 cells. The results were representative of three independent experiments having similar results. **p < .01 and ****p < .0001 as compared to Ala treatment alone.
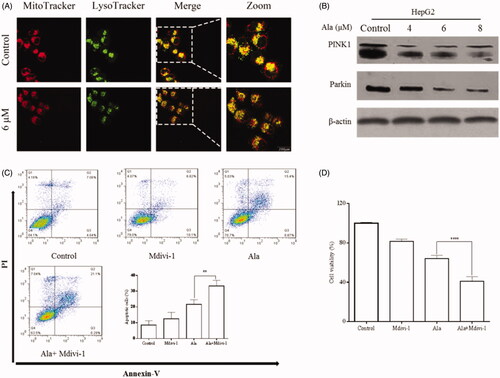
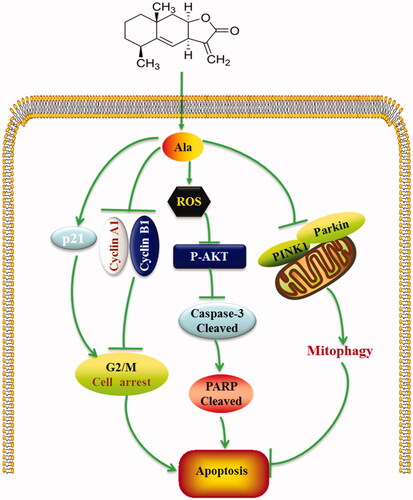
Figure 7. A proposed mechanism of Ala-induced apoptosis in HepG2 cells.