Figures & data
Table 1. The factor levels coding table of P–B design.
Table 2. The factors level coding table of central composite design.
Table 3. The experimental design and results of Plackett–Burman.
Figure 1. The effect of factors to survival rate of BB01 (Y1).
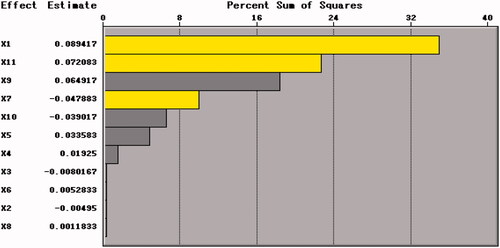
Figure 2. The 95% confidence interval of variable factors for the survival rate of BB01 (Y1).
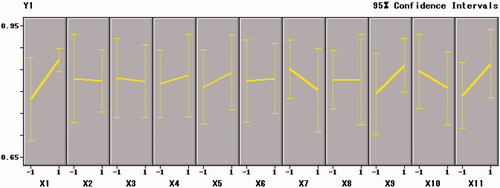
Table 4. Design and results of the path of steepest ascent experiment.
Table 5. Design and results of the path of steepest ascent experiment.
Table 6. ANOVA of the response variables for the hydroxyl free radical scavenging rate (Y1) and the DPPH radical scavenging rate (Y2).
Figure 3. The trends of Y1 (survival rate of BB01) with factors.
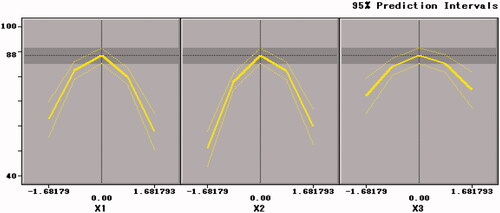
Figure 4. Contour plots and response surface of xylo-oligosaccharides (X1) and arginine (X2) for the survival rate of BB01 (Y1).
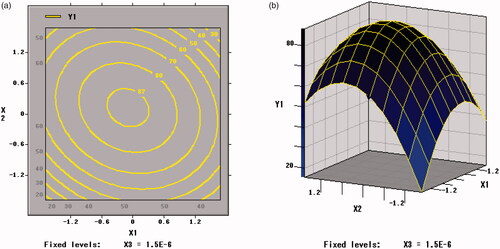
Figure 5. Contour plots and response surface of xylo-oligosaccharides (X1) and skim milk (X3) for the survival rate of BB01 (Y1).
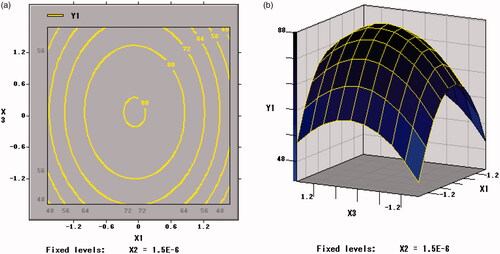
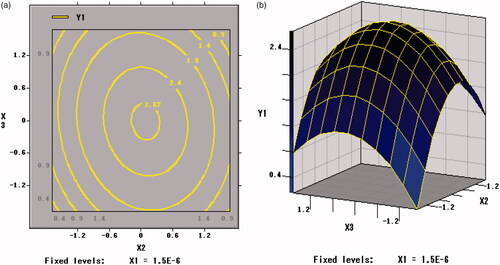
Figure 6. Contour plots and response surface of arginine (X2) and skim milk (X3) for the survival rate of BB01 (Y1).
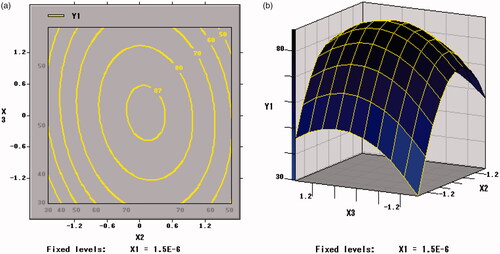
Figure 7. The trends of Y2 (viable counts) with factors.
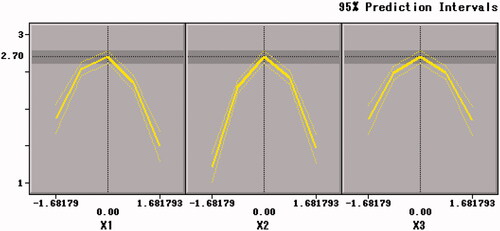
Figure 8. Contour plots and response surface of xylo-oligosaccharides (X1) and arginine (X2) for the viable counts of per unit freeze-dried powder of BB01 (Y2).
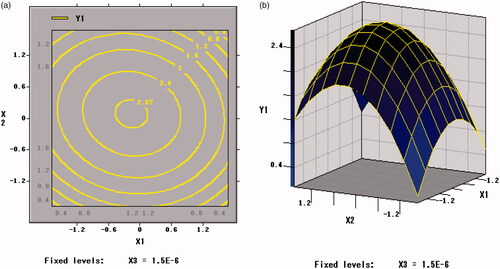
Figure 9. Contour plots and Response surface of xylo-oligosaccharides (X1) and skim milk (X3) for the viable counts of per unit freeze-dried powder of BB01 (Y2).
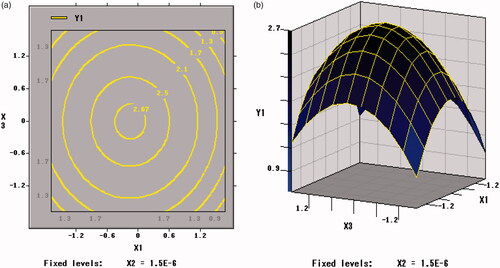
Figure 10. Contour plots and Response surface of arginine (X2) and skim milk (X3) for the viable counts of per unit freeze-dried powder of BB01 (Y2).