Figures & data
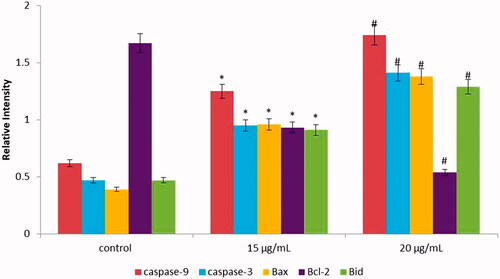
Figure 1. UV–Visible spectrum absorption pattern and SAED pattern of gold nanoparticles synthesised from T. kirilowii. (A) UV pattern of Au-T. kirilowii; (B) SAED pattern of Au-T. kirilowii.
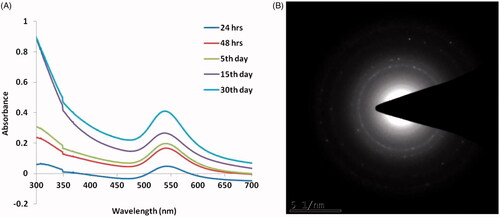
Figure 2. HR-Transmission electron microscopy analysis and X-ray diffraction pattern of gold nanoparticles synthesised from T. kirilowii. (A) HR-TEM analysis of Au-T. kirilowii; (B) XRD pattern of Au-T. kirilowii.
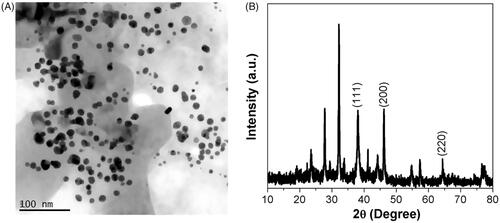
Figure 3. Fourier-transform infrared spectroscopy analysis of gold nanoparticles synthesised from T. kirilowii.
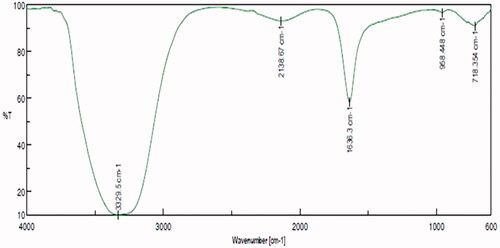
Figure 4. Cytotoxic evaluation of AuNPs at various concentrations against HCT-116 cell lines and 3T3 fibroblast normal cells. All the values are expressed as mean ± SD, #p < .05 when compared with control group.
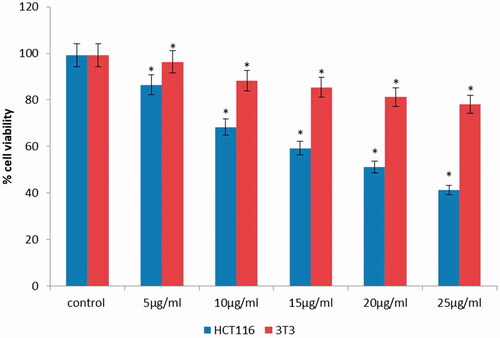
Figure 5. ROS generation in HCT-116 cells treated with AuNPs studied using DCFH-DA staining.
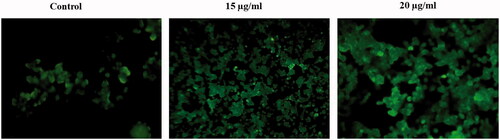
Figure 6. Mitochondrial membrane potential of HCT-116 cells exposure of AuNPs determined by fluorescent dye Rhodamine-123. (A) Morphological images of control and Au-T. kirilowii-treated HCT-116 cells. (B) Mitochondrial membrane potential of HCT-116 cells
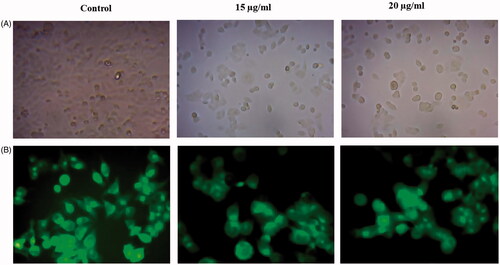
Figure 7. Induction of apoptosis on HCT-116 cells studied using AO/EB staining assay.
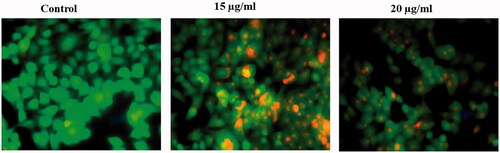
Figure 8. Cell-cycle analysis of HCT-116 cells treatment with AuNPs.
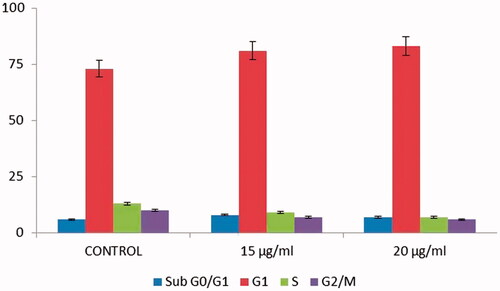
Figure 9. (A–C) Colorimetric assay for caspase-3, 8 and 9 activity expression in AuNPs-treated HCT-116 cells.
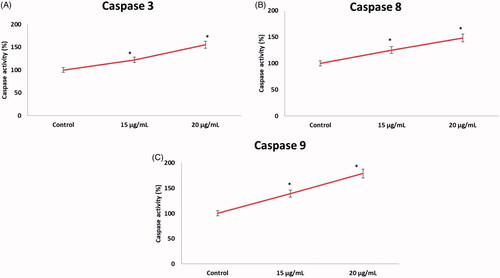
Figure 10. The activity of cellular apoptotic markers was assayed as described in “Materials and Methods” section. Significant differences (p > .05) in apoptotic markers activity were found between the treated and control groups.