
Figures & data
Figure 1. Lidocaine inhibited the growth of lung cancer cells. A549 and NCI-H1299 cells were treated by 8 mM lidocaine for 24 h. (A) Cell viability, (B) apoptosis rate, and (C–E) expression of apoptosis-related proteins were measured using CCK-8 assay, flow cytometry and western blot. * indicates p < .05 vs. control (Ctrl) group.
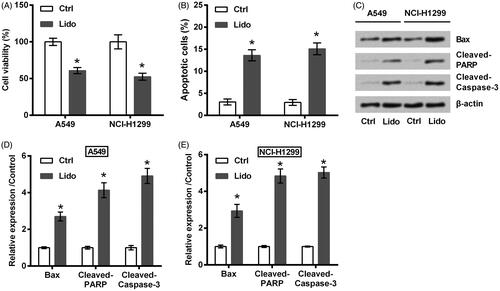
Figure 2. Lidocaine inhibited the metastasis of lung cancer cells. A549 and NCI-H1299 cells were treated by 8 mM lidocaine for 24 h. (A) Migration, (B) invasion, and (C,D) expression of metastasis-related proteins were measured using Transwell assay and western blot. * indicates p < .05 vs. control (Ctrl) group.
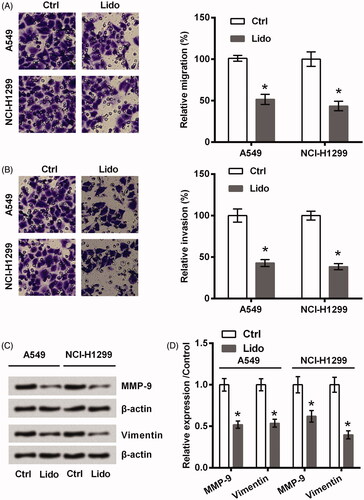
Figure 3. Lidocaine up-regulated the expression of miR-539. A549 and NCI-H1299 cells were treated by 8 mM lidocaine for 24 h. The expression of miR-539 was tested using qRT-PCR. *indicates p < .05 vs. control (Ctrl) group.
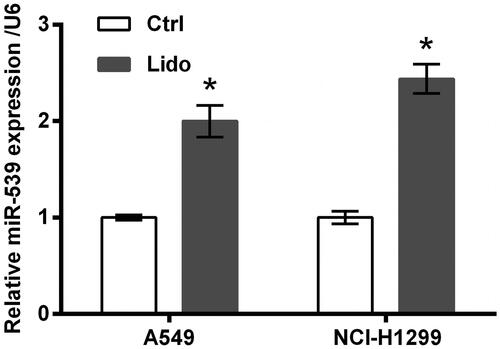
Figure 4. Lidocaine inhibited the growth of lung cancer cells via up-regulating miR-539. (A) A549 and NCI-H1299 cells were transfected with miR-539 inhibitor or NC. The expression of miR-539 was tested using qRT-PCR. The transfected cells were treated by 8 mM lidocaine for 24 h. (B) Cell viability, (C) apoptosis rate, and (D–F) expression of apoptosis-related proteins were measured using CCK-8 assay, flow cytometry and western blot. * indicates p < .05 vs. control (Ctrl) or NC group. # indicates p < .05 vs. Lido + NC group.
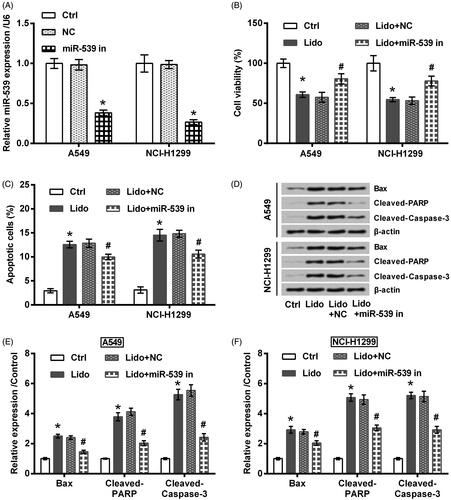
Figure 5. Lidocaine inhibited the metastasis of lung cancer cells via up-regulating miR-539. The transfected A549 and NCI-H1299 cells were treated by 8 mM lidocaine for 24 h. (A) Migration, (B) invasion, and (C,D) expression of metastasis-related proteins were measured using Transwell assay and western blot. * indicates p < .05 vs. control (Ctrl) group. # indicates p < .05 vs. Lido + NC group.
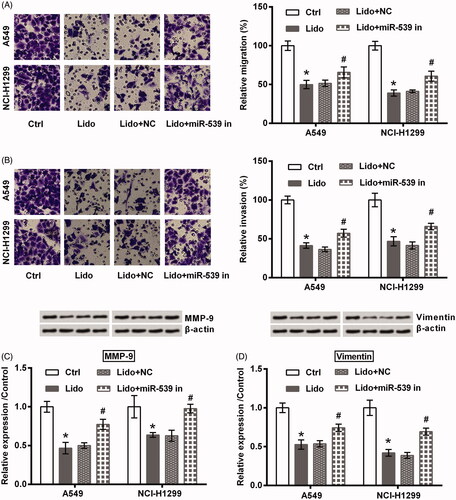
Figure 6. EGFR was a target of miR-539. (A,B) The transfected A549 and NCI-H1299 cells were treated by 8 mM lidocaine for 24 h. The expression of EGFR protein was tested using western blot. (C) The predicted binding sites between miR-539 and the 3’UTR of EGFR. (D) Luciferase activity assay was utilized to confirm the binding effects between miR-539 and EGFR. * indicates p < .05 vs. control (Ctrl) or NC group. # indicates p < .05 vs. Lido + NC group.
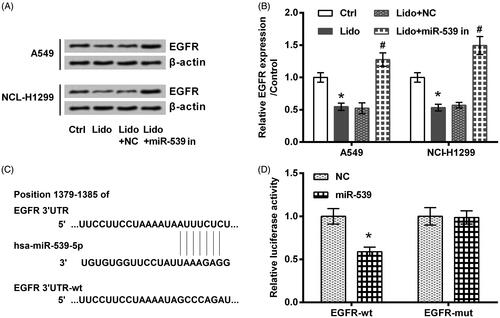
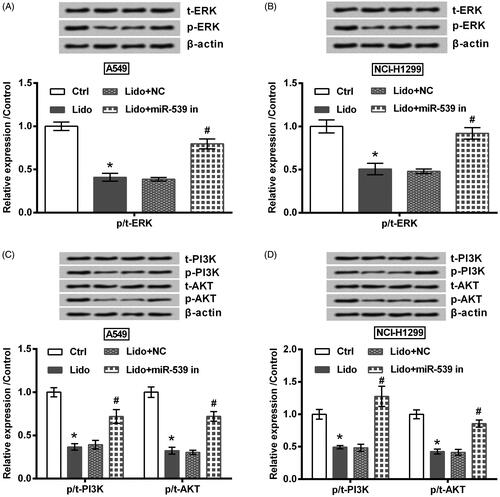
Figure 7. Lidocaine suppressed the activation of ERK and PI3K/AKT pathways via up-regulating miR-539. The transfected A549 and NCI-H1299 cells were treated by 8 mM lidocaine for 24 h. The phosphorylation levels of (A,B) ERK, (C,D) PI3K and AKT were determined using western blot. * indicates p < .05 vs. control (Ctrl) group. # indicates p < .05 vs. Lido + NC group.
Availability of data and materials
The datasets used and/or analyzed during the current study are available from the corresponding author on reasonable request.