
Figures & data
Figure 1. Characterization of AgNPs synthesized by lysate of Gibberella sp. (A) UV-visible spectra of colloidal solution of AgNPs; (B) Size distribution of AgNPs; (C) SEM image of AgNPs; (D) The component of protein corona with different isoelectric point was based on the result of LC-MS.
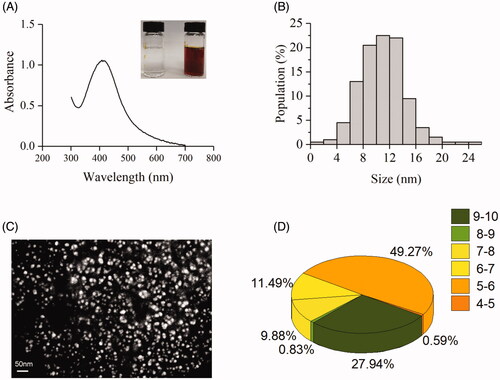
Figure 2. Cytotoxicity of AgNPs on HeLa cell and the antioxidant role of ascorbic acid (vit. C). (A) HeLa cells at different growth stages were treated with serial concentrations of AgNPs at 37 °C for 12 h. The alive cells were measured by ATP contains; (B) Intracellular ROS levels in HeLa cells after 60 h grown treated with 10 μg/mL AgNPs with or without 800 μM vit. C for 3 h; (C) Apoptosis analysis with flow cytometry. The treated HeLa cells were detected with DCFH-DA fluorescent probe as the protocol provided by Solarbio life sciences (China). The data collected from 3 independent experiments were expressed as mean ± standard deviation (SD). ∗∗p < .01, ∗∗∗p < .001.
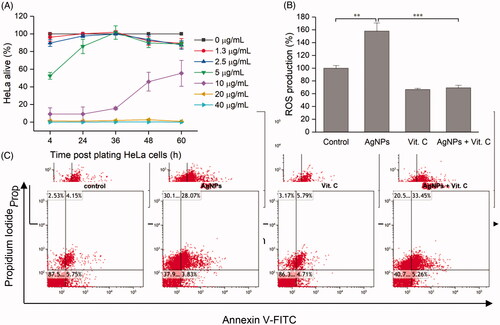
Figure 3. Ascorbic acid eliminates the lethal effects of AgNPs on E. coli and S. aureus. MBC values of various concentrations (on the top of the panel) of E. coli (A) and S. aureus (B) that were treated with serial concentrations of AgNPs at 37 °C for 12 h. 107 CFU/mL of E. coli (C) and S. aureus (D) were treated with 10 μg/mL AgNPs and/or 800 μM vit. C for 3 h. The living bacteria in all experiments were counted on agar plates after neutralizing AgNPs with 1 mmol/L Na2S. The data collected from 3 independent experiments were expressed as mean ± SD. ∗∗p < 0.01, and ∗∗∗p < .001.
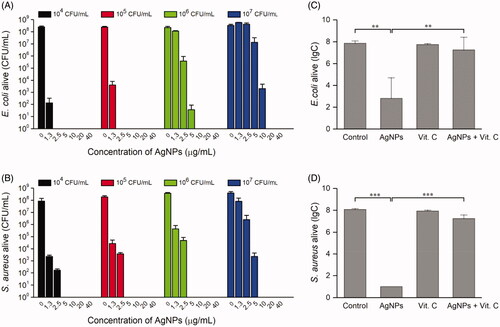
Figure 4. The inhibition of E.coli TrxR by AgNPs in vitro. The pure E. coli TrxR at 100 nM was incubated with indicated concentration of E.coli AgNPs for 10 min, then Trx at 5 μM Trx and 2 mM DTNB were added to assay the TrxR activity. The dosage of AgNPs were adjusted to the same concentration of silver ion, in detail, 0.54 μg/mL AgNPs is equal to 1 μM silver ion.
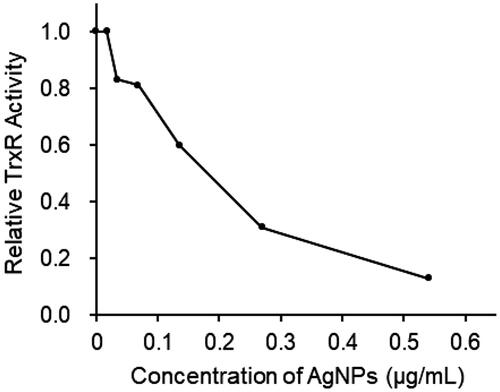
Table 1. Fractional inhibitory concentration (FIC) of AgNPs combined with ebselen against E. coli and S. aureus.
Figure 5. The synergistic killing effect of AgNPs and ebselen against E. coli and S. aureus. The growth curves of E. coli (A) and S. aureus (B) were treated with different concentrations of AgNPs and/or ebselen as described in the legend. After 9 h treatment, 10 μL culture of each group were plated on the agar plates to detect the killing effect. All experiments were repeated three times.
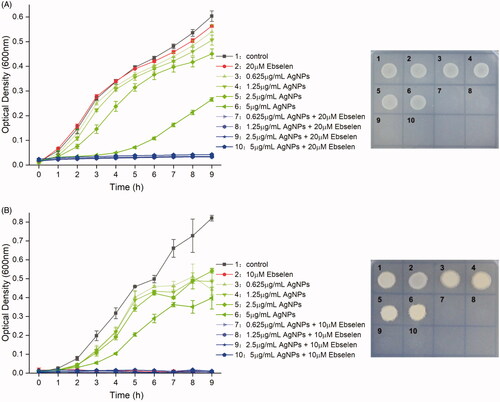
Figure 6. The cytotoxicity of AgNPs on HeLa and the protection of ebselen. HeLa cells were treated with serial concentrations of AgNPs and ebselen combinations for 12 h in RPMI-1640 without FBS. The data collected from 3 independent experiments were expressed as mean ± SD. ∗p < .05, ∗∗p < .01.
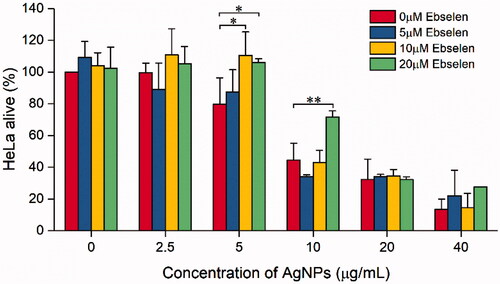
Figure 7. The time-survival curve of E. coli and S. aureus treated with AgNPs and ebselen coexistence with HeLa cells. HeLa cell has incubated in 96-well plates for 60 h before the addition of 107 CFU/mL bacteria. Final concentration of 5 μg/mL AgNPs, 20 μM ebselen, and 5 μg/mL AgNPs + 20 μM ebselen were used in this experiment, respectively. The data collected from three independent experiments were expressed as mean ± SD. ∗p < .05, ∗∗p < .01, and ∗∗∗p < .001.
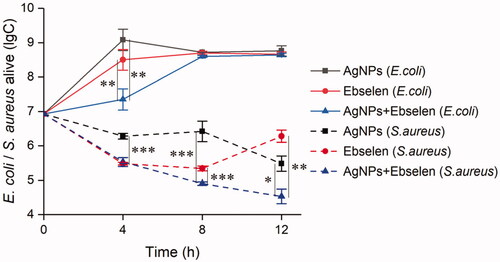
Figure 8. The comparison of synergistic antibacterial effect of AgNPs and ebselen against clinical MDR E. coli strain in vitro and in vivo. (A) The growth curve of mcr-1 colistin resistance STEC CQ10 was determined under series of concentration of AgNPs and/or ebselen by a fully automatic growth curve tester. A drop of 10 μL culture of each group was plated onto LB agar plate after 9 h treatment. (B) The survival curve of mice (n = 8). Mice were injected subcutaneously with PBS or 2.4 mg AgNPs/kg-weight, or 2.4 mg AgNPs and 30 mg ebselen/kg-weight in two separate sites, 1 h after challenge with 2 LD50 CQ10 strain. The drug control was used to test the safety of AgNPs and ebselen combination, did not challenge with bacteria.
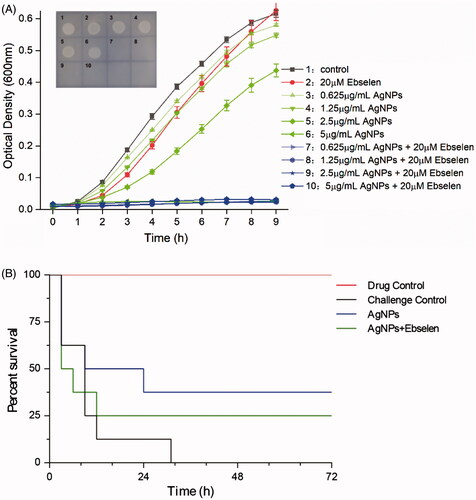
Table A1. The component of protein corona.