
Figures & data
Figure 1. Location of the study areas.
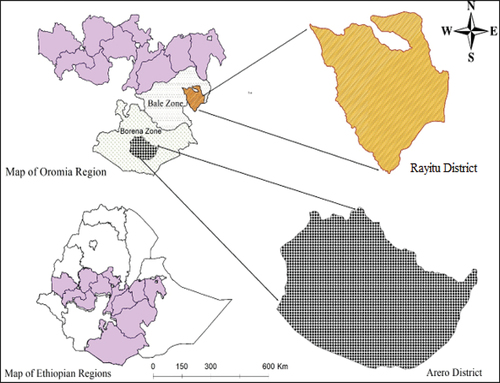
Table 1. Socio-demographic profile of households
Table 2. The result of Sen’s slope for minimum maximum and, average temperature and precipitation
Table 3. Livelihood diversification of household
Table 4. Mean comparison of selected continuous variables by poverty status
Table 5. The result of Foster-Greer-Thorbecke (FGT) decomposable index
Table 7. ATT and ATU of livelihood diversification: MESR Estimates
Table 6. Tobit model regression estimates and marginal effects of poverty determinants