
Figures & data
Figure 1. Proportional representation of intra-organizational bilateral trade as a percentage of the overall trade volume and total trade volume measured in thousand dollars among member countries.
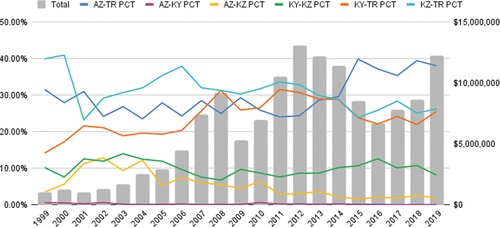
Figure 2. Share of total exports and imports of the four-member Turkic states between 1999–2019.
Figure 3. Total exports from organization of Turkic states members in 2019 and top partners with shares of more than $4B.
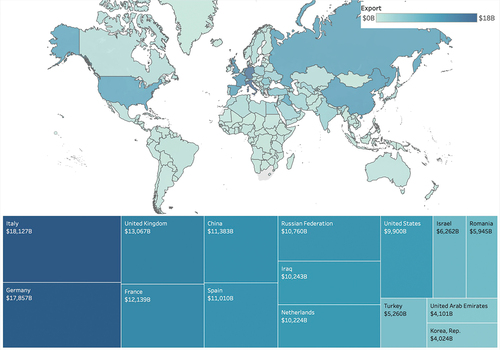
Table 1. Sample studies using TOPSIS in different decision making processes between 2015 and 2023
Table 2. Sample studies using TOPSIS continues
Table 3. Descriptive statistics of trade data from six Turkic states and Tajikistan used in gravity analysis
Figure 4. Trade volumes within the four members of OTS with a display of the exponential regression trend line.
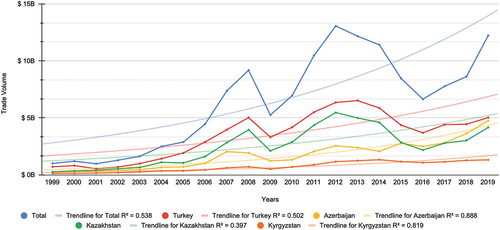
Table 4. Pearson correlation coefficients representing the trade data analysis of six Turkic states and Tajikistan for gravity analysis. Statistical significance is indicated by and
, denoting significance levels of 1% and 5% respectively
Table 5. OLS results for the gravity model where the dependent variable is lnEX
Table 6. PPML result for the gravity model where dependent variable is integer EX
Table 7. The steps of the TOPSIS algorithm for the years 2000–2009 and 2010–2019 where the criteria were determined as exports to Turkic states (A1), imports from Turkic states (A2), the percentage share of exports to Turkic states in all exports (A3), and the percentage share of imports from Turkic states in all imports (A4)
Table 8. The steps of the TOPSIS algorithm for the yearly comparison between 2000–2019 for Turkey
Table 9. Relative closeness for alternative years for Turkey
Table 10. Relative closeness for alternative years for Azerbaijan
Table 11. Relative closeness for alternative years for Kazakhstan
Table 12. Relative closeness for alternative years for Kyrgyzstan