
Figures & data
Figure 1. Projection of global Muslim expenditure on clothing compared to all halal products and the lifestyle sector.
Source: State of The Global Islamic Economy Report (Citation2022).
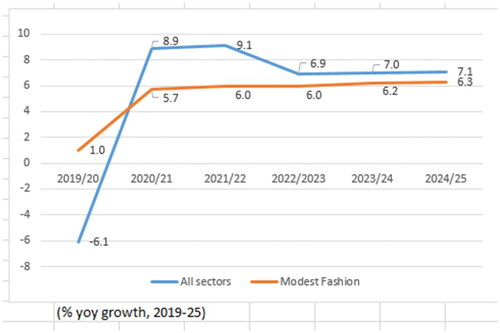
Table 1. Top exporters to OIC and top fashion importers in OIC.
Table 2. The company’s omnichannel warehouse target in fulfilling customer orders in 2020.
Figure 2. Research stages.
Source: The author’s analysis (2021).
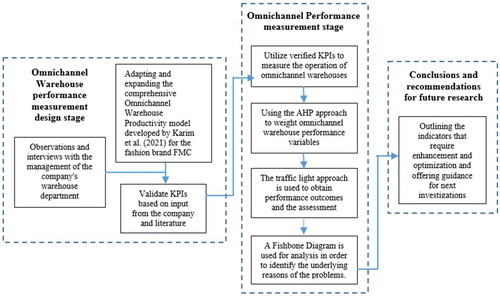
Figure 3. Revenue percentage of the four industries in the FMC in 2019–2020.
Source: Unpublished Warehouse Inventory Records (Citation2021).
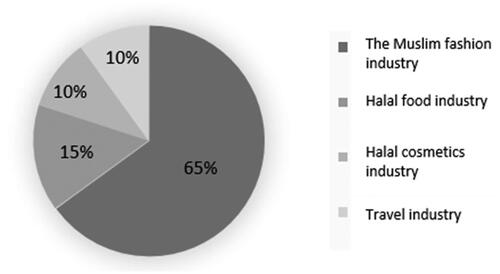
Figure 4. Product distribution in the omnichannel warehouse by brand.
Source: Unpublished Warehouse Inventory Records (Citation2021).
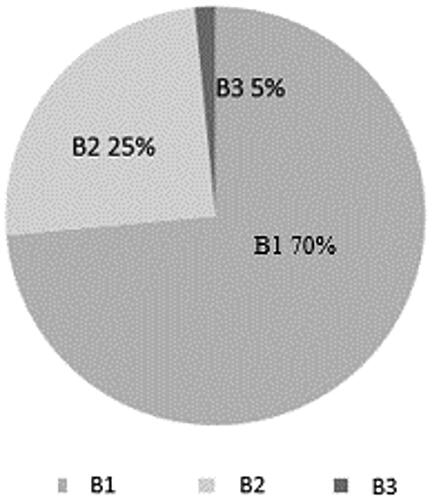
Table 3. KPIs for the FMC’s omnichannel warehouse.
Table 4. Respondents for performance weighting questionnaire completion.
Table 5. Weighting for each KPI of the company’s omnichannel warehouse.
Table 6. Result of traffic light system aggregation for the KPIs in the company’s omnichannel warehouse.
Figure 5. An illustration of omnichannel retail in the FMC.
Source: The author’s analysis (2021).
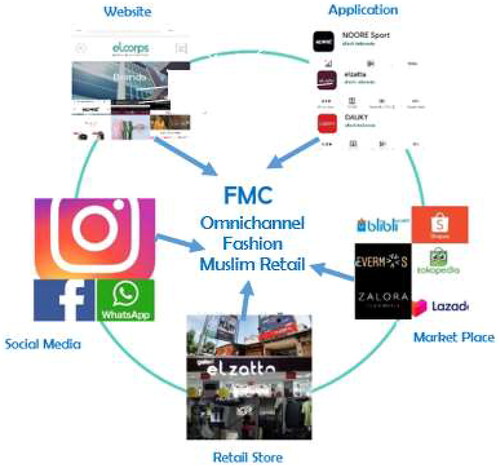
Figure 6. Overview of FMC fashion omnichannel warehouse activities.
Source: The author’s analysis (2021).
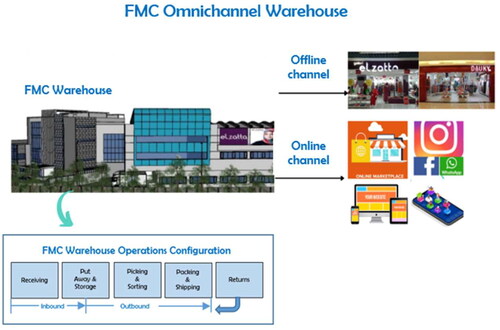
Figure 7. Fishbone diagram for issues in the product receiving section of the omnichannel warehouse of the company (2021).
Source: Author’s analysis (2021).
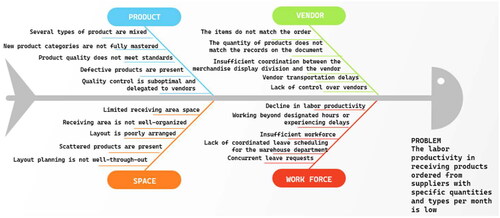
Figure 8. Fishbone diagram for issues in the product identification section by warehouse workforce in the company’s omnichannel (2021).
Source: Author’s analysis (2021).
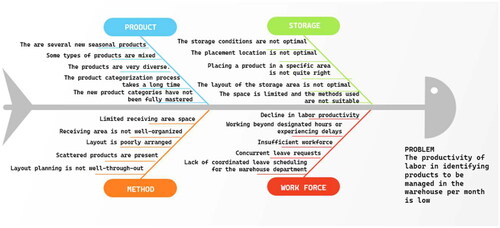
Figure 9. Fishbone diagram for issues in the offline order picking section of the company’s omnichannel warehouse (2021).
Source: Author’s analysis (2021).
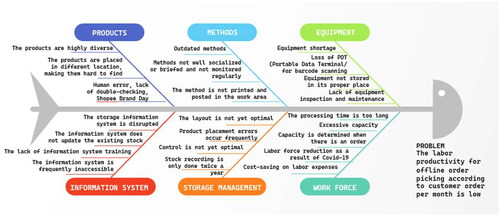
Figure 10. Fishbone diagram for problems in the transport utilization section in the company’s omnichannel warehouse (2021).
Source: Author’s analysis (2021).
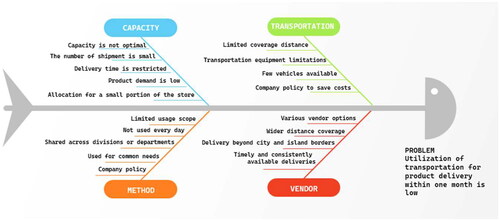
Table 7. Current performance measurement of omnichannel warehouse FMC.
Table 8. Comparison between current warehouse performance and proposed omnichannel warehouse performance for the company.