
Figures & data
Figure 1. First map of policy actor visualization results of Task Force for COVID-19 handling in Bandung City.
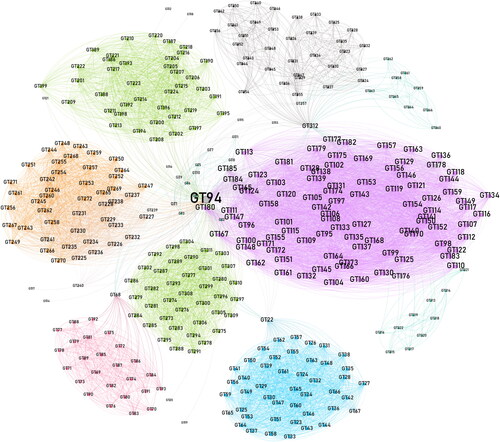
Figure 2. Second map of policy actor visualization results of Task Force for COVID-19 handling in Bandung City.
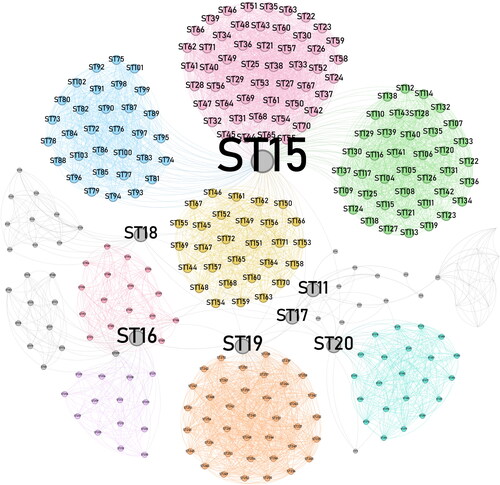
Figure 3. Actor circle of COVID-19 handling in Bandung City.
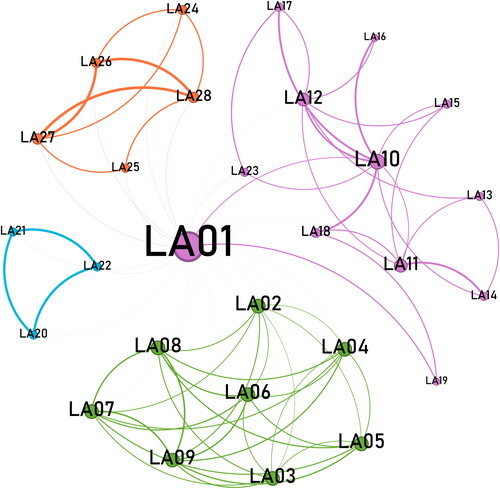
Figure 4. Visualization results of the policy actor of the COVID-19 Economic Recovery Committee in Bandung City.
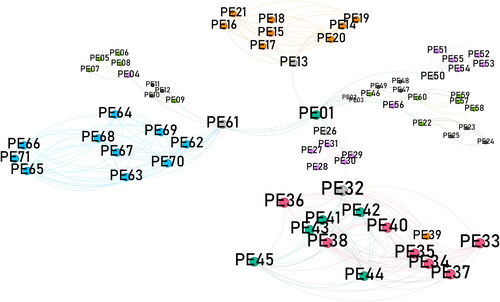
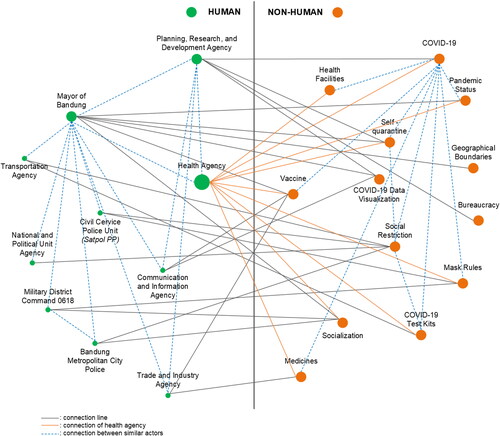
Figure 5. Socio-technogram network diagram in handling COVID-19 in Bandung City.
Appendix 1. First map of policy actor visualization results of Task Force for COVID-19 handling in Bandung City (Figure 1).
Appendix 2. Second map of policy actor visualization results of Task Force for COVID-19 handling in Bandung City (Figure 2).
Appendix 3. Actor circle of COVID-19 handling in Bandung City (Figure 3).
Appendix 4. Visualization results of the policy actor of the COVID-19 Economic Recovery Committee in Bandung City (Figure 4).
Data availability statement
Non applicable.