
Figures & data
Figure 1. Stages and steps of Q, adapted from (Zabala et al., Citation2018).
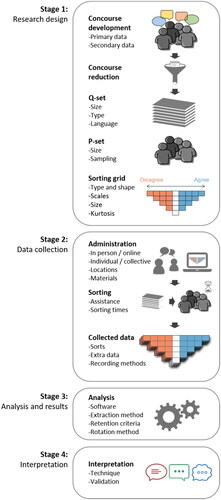
Table 1. Data extracted from the 50 selected studies.
Figure 2. Characteristics of the selected studies. (a) Number of studies across disciplines of agriculture (AG), international development (ID), environmental studies (ES), conservation (CO), forests and forestry (FF), veterinary sciences (VS), and others (OT). (b) Number of studies per category of Q study [as defined by (Zabala et al., Citation2018)] as conflict resolution (CR), management alternatives (MA) and policy appraisal (PA). (c) Number of studies published as (non)open-access documents. (d) Number of studies per geographical region, across Australasia (AA), East Asia (EA), Eastern Europe (EE), Middle East (ME), Central America (CA), South America (SA), South Asia (SAs), Southeast Asia (SEA) and sub-Saharan Africa (SSA); solid dark gray, solid light gray and diagonal-line patterns on each bar represent the proportions of low-, lower-middle- and upper-middle-income countries, respectively.
![Figure 2. Characteristics of the selected studies. (a) Number of studies across disciplines of agriculture (AG), international development (ID), environmental studies (ES), conservation (CO), forests and forestry (FF), veterinary sciences (VS), and others (OT). (b) Number of studies per category of Q study [as defined by (Zabala et al., Citation2018)] as conflict resolution (CR), management alternatives (MA) and policy appraisal (PA). (c) Number of studies published as (non)open-access documents. (d) Number of studies per geographical region, across Australasia (AA), East Asia (EA), Eastern Europe (EE), Middle East (ME), Central America (CA), South America (SA), South Asia (SAs), Southeast Asia (SEA) and sub-Saharan Africa (SSA); solid dark gray, solid light gray and diagonal-line patterns on each bar represent the proportions of low-, lower-middle- and upper-middle-income countries, respectively.](/cms/asset/cec50e90-2790-4c20-88d1-51e78b5a69f4/oass_a_2359018_f0002_b.jpg)
Figure 3. Geographic location of main authors’ affiliations and studies per the theme of Q study [as defined by (Zabala et al., Citation2018)].
![Figure 3. Geographic location of main authors’ affiliations and studies per the theme of Q study [as defined by (Zabala et al., Citation2018)].](/cms/asset/23825b8c-fea4-4660-bdb6-90871eb7bedb/oass_a_2359018_f0003_c.jpg)
Figure 4. Characteristics of the concourse. (a) Number of studies per source for concourse construction, based on primary data (PD), secondary data (SD) and mixed sources (PD/SD). (b) Size of the constructed concourse in a number of statements across studies. (c) Number of studies per concourse reduction technique, comprising software (SW), matrix method (MM), iterative refinement (IR), expert judgement (EJ), division in discourses (DD), categorization (CT), combination and deletion of similar statements (CD), content analysis (CA). (d) Concourse reduction ratio across studies, expressed as the decreasing percentage between the concourse and the Q-set.
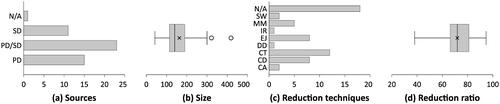
Figure 5. Characteristics of research design. (a) Q-set size in a number of statements across studies. (b) Number of studies per P-set sampling techniques, including convenience sampling (CS), purposive sampling (PS), random sampling (RS), stratified random sampling (SRS), snowball sampling (SS) and structured sampling (STS). (c) P-set size in number of participants across studies. (d) Q-set/P-set ratio across studies.
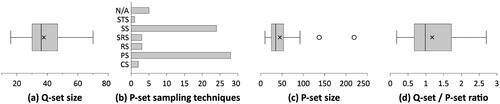
Figure 6. P-set size and genders. (a) Number and gender of participants per each of the 50 studies. Numbers on the X-axis correspond to the references. Solid dark gray, solid light gray and diagonal-line patterns on each bar represent the proportions of female participants, male participants, and gender-unspecified participants, respectively. Dashed line, dotted-dashed line and dotted line represent the average of female, male and total participants across studies, respectively. (b) Female/Male ratio across the selected studies. Barbosa et al. (Citation2020) considered female participants only, thus is not represented here.
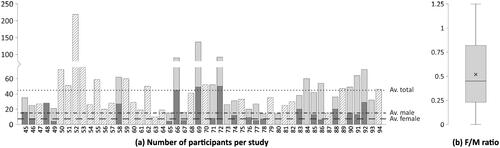
Figure 7. Sorting grids of the selected studies. 1(Anderson and Jacobson, Citation2018; Brannstrom, Citation2011; Forouzani et al., Citation2013; Huaranca et al., Citation2019; Hugé et al., Citation2016) did not report the orientation of their grids. They were assumed as inverted distributions. 2The shaded area with thicker border represents the second grid used in (Carmenta et al., Citation2017). 3(Hilhorst et al., Citation2012) did not use a quantitative scale; instead, its authors reported graphical hints (happy/sad faces). 4Reported grids of (Rodríguez-Piñeros and Mayett-Moreno, Citation2015; Schneider et al., Citation2015) did not match with their respective number of statements. 5(Sumberg et al., Citation2017; Yeboah et al., Citation2017) resorted to two grids; only information of one of them was provided.
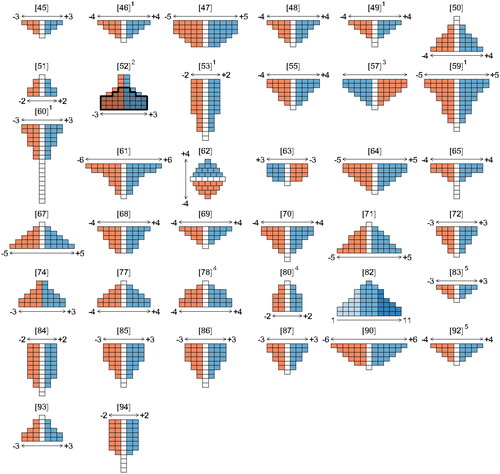
Table 2. Characteristics of sorting grids with regard to their size and kurtosis.
Figure 8. Sorting times across the selected studies. (a) Absolute sorting time in minutes. (b) Sorting time ratio, expressed in seconds per statement. (c) Sorting time ratio, expressed in seconds per statement per sorting points.
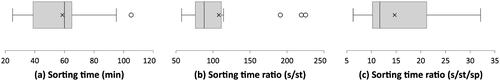
Table 3. Summary of discussed challenges due to the implementation of Q in RGS settings and respective good practices.
Supplemental Material
Download Zip (594.4 KB)Data availability statement
The dataset related to this study can be found at https://doi.org/10.34894/K252KB, an open-source online data repository hosted at DataverseNL (Intriago Zambrano, Citation2020).