Figures & data
Figure 1. Schematic synthesis route of mPEG–PCL copolymer.
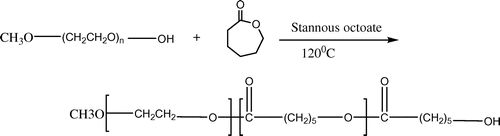
Figure 2. Schematic illustration of preparation of mPEG–PCL nanoparticles; (a) o/w emulsion solvent evaporation.
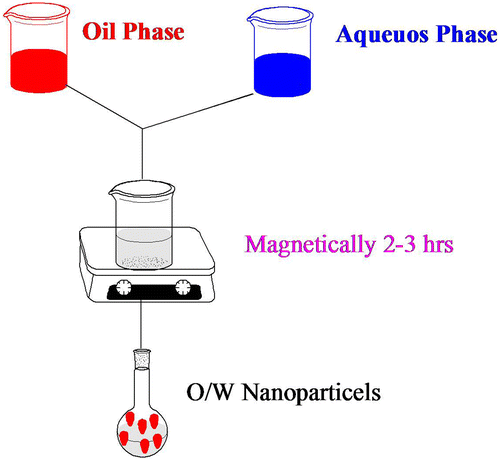
Figure 3. Schematic illustration of preparation of mPEG–PCL nanoparticles; (a) Nanoprecipitation.
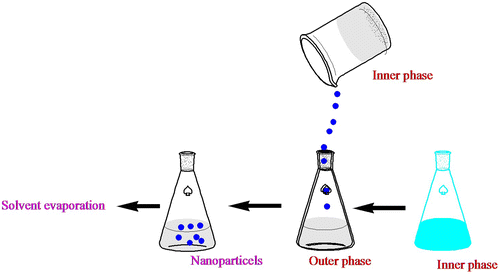
Table 1. Categorization of demonstrated mPEG–PCL nanoparticles based on the method of preparation
Figure 4. AFM image of micelles.
Source: Kheiri et al. (Citation2016).
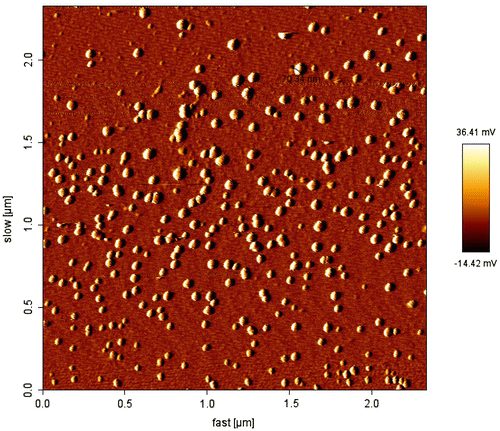
Figure 5. Particle size distribution of mPEG–PCL–DOX micelles.
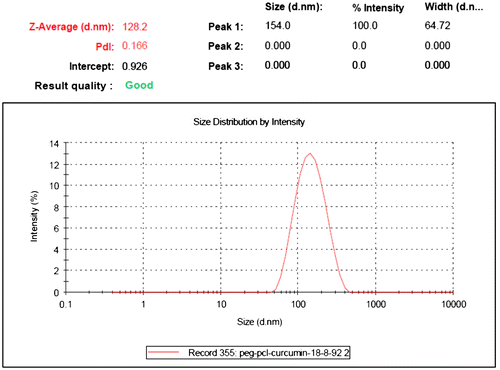
Figure 6. FTIR spectra of (a) curcumin, (b) mPEG–PCL and, (c) CUR-mPEG–PCL micelles.
Note: Spectrum blue is for curcumin, the red belongs to mPEG-PCL and pink belong to micelles. Source: Danafar, Rostamizadeh, Davaran, Valizadeh, et al. (Citation2014).
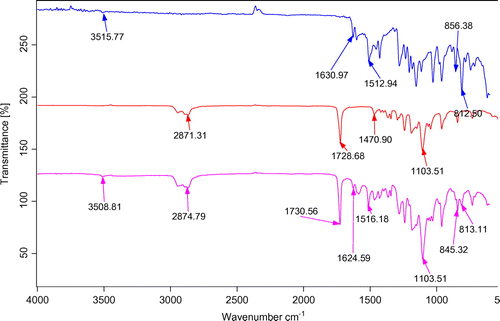
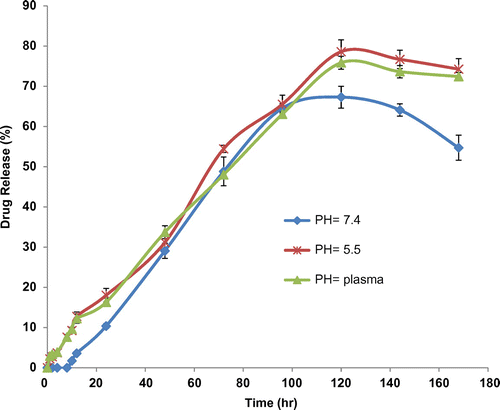
Figure 7. The release profiles of curcumin from CUR-mPEG–PCL micelles in different release media (a) pH 7.4, (b) plasma, and (c) pH 5.5.
Source: Danafar, Rostamizadeh, Davaran, Valizadeh, et al. (Citation2014).