Figures & data
Table 1. Primer combinations, the annealing temperature (Ta) and expected amplicon size (bp) for each set of primers used in this study
Table 2. Molecular Operational Unit Taxonomic (MOTU) identified for Chlorophyta, indicating the number, location of isolates (Table S1), and GenBank accession numbers (AN)
Table 3. MOTU identified for Cyanobacteria, indicating the number, location of isolates (Table S1), and GenBank accession numbers (AN)
Table 4. Molecular identification of the Chlorophyta strains used in this study, including the percentage of identity, accession number, and the name of the identified species in the GenBank database, based on the 18S V4 and rbcL marker sequence. * indicates query cover below 100%
Figure 1. Phylogram constructed using 18SV4 rDNA sequences from Ecuadorian strains and sequences in the GenBank database belonging to the Chlorophyceae class. The phylogram was constructed using the maximum-likelihood method with a Kimura 2-parameter model using a discrete Gamma distribution (+G). Numerical values at the nodes of the branches indicate bootstrap values above 50%
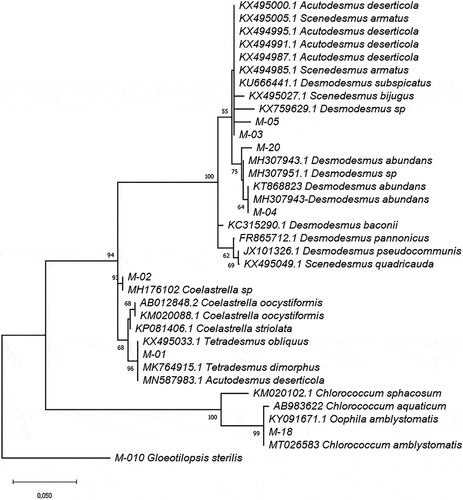
Figure 2. Phylogram constructed using 18SV4 rDNA joined to rbcL sequences of the Ecuadorian MOTUs. The phylogram was constructed using the maximum-likelihood method with a Kimura 2-parameter model. Numerical values at the nodes of the branches indicate bootstrap values above 50%
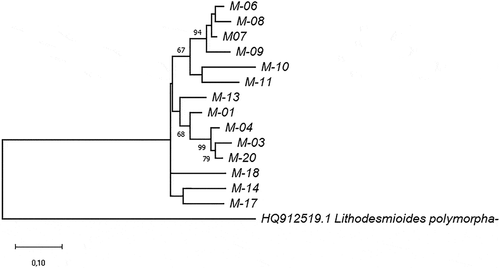
Figure 3. Phylogram constructed using 18SV4 rDNA sequences from Ecuadorian strains and similar sequences in the GenBank database belonging to the Trebouxiophyceae class. The phylogram was constructed using the maximum-likelihood method with the Kimura 2-parameter model using a discrete Gamma distribution (+G). Numerical values at the nodes of the branches indicate bootstrap values above 50%
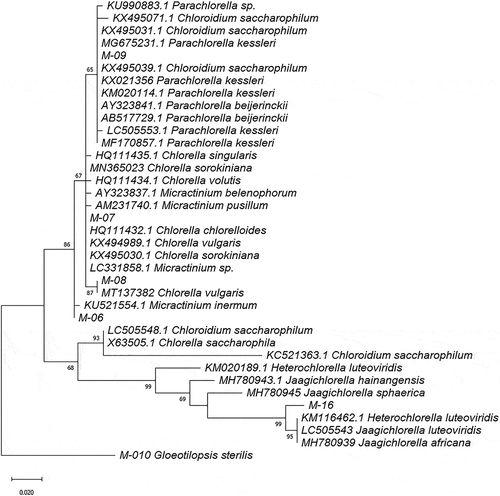
Table 5. Molecular identification of the Cyanobacteria strains used in this study, including the percentage of identity, accession number, and the name of the identified species in the GenBank database, based on the 16S and ITS marker sequence. * indicates query cover below 100%
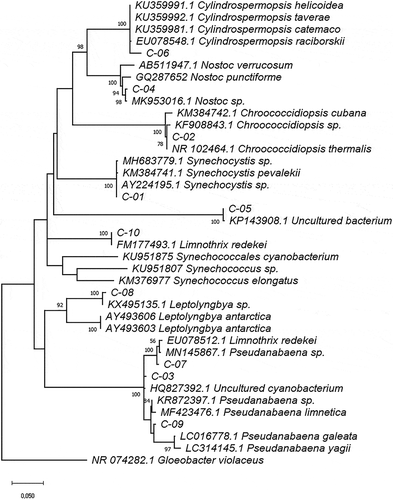
Figure 4. Phylogram constructed using 16S rDNA sequences from Ecuadorian cyanobacteria and similar sequences at the GenBank database. The phylogram was constructed using the maximum-likelihood method with Kimura 2 distance. Numerical values at the nodes of the branches indicate bootstrap values above 50%