
Figures & data
Figure 1. Stimulus design. Change was presented either in intensity or frequency (not both). It was either an increment followed by a decrement or vice versa. A control condition presented no change. See details in the text.
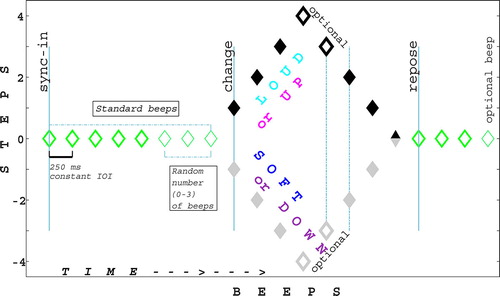
Figure 2. Acceleration and EMG data alignments. Three alignments were used to shed light on the relation between the yielded (jittery) human action and the isochronous stimulus. Two of them are aligned to tap moments – either the precedent or the subsequent tap, and one is aligned to the beep onset. Note the jitter inherent in each.
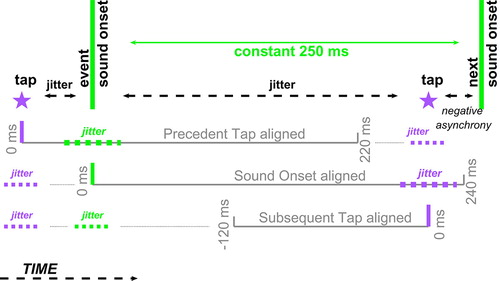
Figure 3. Timing results – deviations from personal negative mean asynchrony (NMA) and from the “ideal” 250 ms inter-tap interval (ITI) under the test conditions. Standard error of the mean is given. Baselines appear as green lines. Statistically significant differences from NMA and from inter-onset interval (IOI, 250 ms) are noted by stars; significant differences between condition pairs within parameter by diamonds. Panes titled TRU present the data. Panes titled EXC present the post-hoc manipulation (see text), switching condition-pairs within parameter in segment 2.
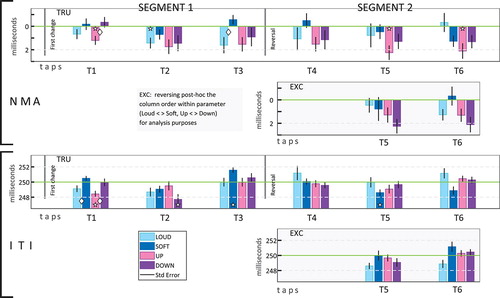
Table 1. Tap timing, Analysis 1. Main results of the rmANOVAs and statistically significant contrasts (also for the NMA interaction, which was just short of statistical significance). P values are corrected for multiple comparisons. Asterisks mark strong significance. Marginal results are grayed and italicized. For effect size calculation see text. For contrasts, timing gaps are given. For larger NMA (earlier taps), negative values are given. L, S, U, D = Loud, Soft, Up, Down.
Figure 4. Analysis 2 – results of factors Location and Condition. RmANOVAs for NMA and ITI, with factors Segment (x2), Location in segment (x3) and Conditions (x5) were run. Note: EXC only treats locations 2&3; for the factor Location, they are identical for TRU and EXC. TRU data are shown by diamonds, EXC by squares. All ANOVAs are significant. Significant contrasts (lines) and significance vs baseline (rings) appear in red (TRU) and orange (EXC). Error bars depict standard error of the mean. See the Location*Condition interaction in the SpMtrl, sheet B1.
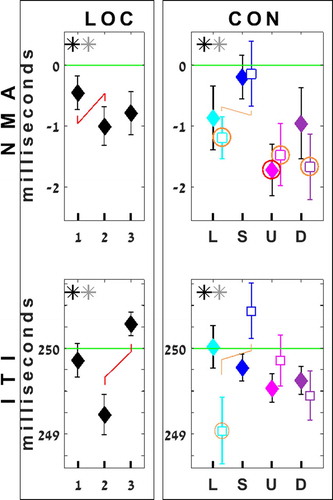
Table 2. Analysis 2, Step-sets in TRU vs EXC. Different gaps between segments and between within-parameter stimuli in TRU vs EXC aid to assess the effects of change vs absolute values. In Segment_2, one third of the trials were further from standard (due to a 4th beep in Segment_1). The steps for increments are specified; decrements were a mirror set.
Table 3. Tap timing, Analysis 2. RmANOVAs results, with factors Segment (x2), ordinal Location of the tap in the segment (Location: TRU: x3; EXC: x2), and Condition (x5). Non-significant results in gray, italicized. Partial Eta squared values only are given. For the full table: cf SpMtrl, Sheet B2.
Figure 5. Subsequent Tap data alignment – deviations from baseline under the four test conditions. Each data point stands for a 20 ms time bin of the epoch −120 ms to 0 (touchdown). Only the accelerometer results and those of the two distal antagonist muscles are shown. The figure format here will be iterated in –; it is explained here. Segment-wide results – in boxes at the outset of each segment: conditions (circles, for L, S, U, D), cond. contrasts (bi-color “diamonds”, for LvS, UvD), and groupings (asterisk pairs, for L&U v S&D, INT v FRQ). Beat*Condition interactions – at inset bottom: conditions (triangles, for L, S, U, D), and cond. contrasts as before. Triple interactions (Beat*Condition*Tbn) – on the conditions’ lines (squares), or at the insets’ tops for condition contrasts (bi-color stars).
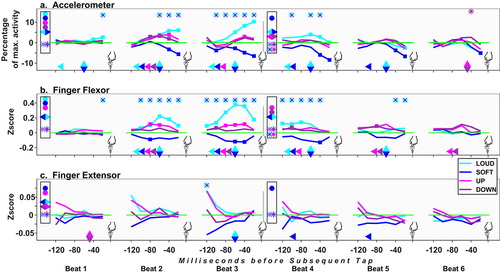
Figure 6. Precedent Tap data alignment: deviations from control under the four test conditions. See symbols explanation in ’s caption. Depiction of the accelerometer’s results (top panel) is split to beat halves, both at each segment’s outset and along the sequence; see above in the chapter statistical procedures for acceleration and EMG data.
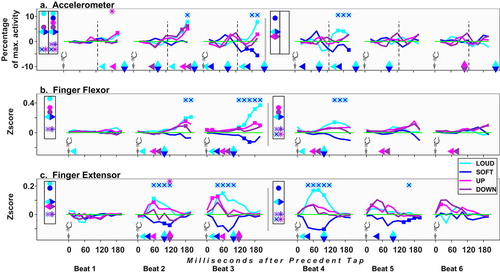
Figure 7. Sound Onset data alignment: deviations from control under the four test conditions. See about symbols in the caption for . Here too, accelerometer results are split by beat halves; see details in statistical procedures.
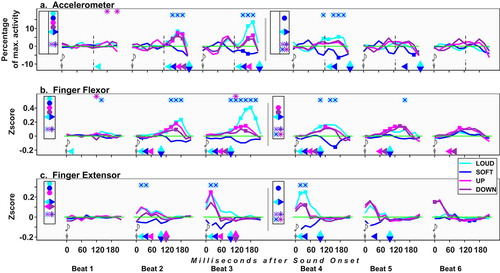
Table 4. Alignment to Subsequent Tap, comparison vs baseline. Separate rmANOVAs for each index (Accelerometer, Flexor and Extensor), for each segment, were run, with factors Beats (x3), Time bins (Tbn, x6) and Conditions (x5). Non-significant results are grayed out and italicized. Full details (df, F, p, gnrlzd. η2): cf SpMtrl Sheet C.
Table 5. Alignment to Precedent Tap, comparison vs baseline. For the accelerometer beats were split due to the data being directional – movement toward/away from the tapping board; see text. Of the two halves, the later’s results are given, reflecting the tapping action. Non-significant results are grayed and italicized. Full statistics: cf SpMtrl Sheet D.
Table 6. Alignment to Sound Onset, comparison vs baseline. As related in Table 5 and in the text, for acceleration data only results of beats’ later half are given. Non-significant results are grayed and italicized. Full statistics: cf SpMtrl Sheet E.