Figures & data
Figure 1. Structure of rosmarinic acid.
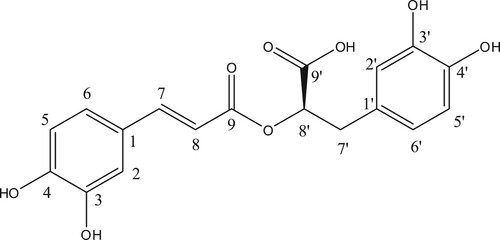
Table 1. 1H and 13C- NMR data for isolated compound rosmarinic acid (500 MHz, Acetone).
Table 2. Effect rosmarinic acid on the changes in plasma glucose, insulin levels and HOMA-IR index in control and experimental animals.
Table 3. Effect of rosmarinic acid on body weight, fluid intake, food intake, liver weight and urine sugar of control and experimental animals.
Table 4. Effects of rosmarinic acid on haemoglobin and gycosylated haemoglobin levels in control and experimental animals.
Table 5. Effects of rosmarinic acid on the levels of glycogen content, glycogen synthase and glycogen phosphorylase in control and experimental animals.
Figure 2. Changes in the levels of plasma glycoproteins in control and experimental animals. Values are given as mean ± SD for six animals in each group. Values are considered significantly different at P < 0.05 with post hoc LSD test *P < 0.05. (a) Control vs. Rosmarinic acid alone treated control rats. (b) Control rats vs. diabetic rats. (c) Diabetic rats vs. Rosmarinic acid treated diabetic rats. (d) Rosmarinic acid treated diabetic rats vs. Metformin treated diabetic rats.
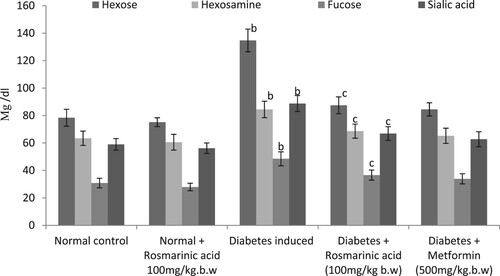
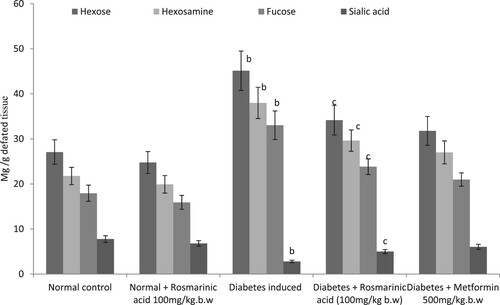
Figure 3. Changes in the levels of liver glycoproteins in control and experimental animals. Values are given as mean ± SD for six animals in each group. Values are considered significantly different at P < 0.05 with post hoc LSD test *P < 0.05. (a) Control vs. Rosmarinic acid alone treated control rats. (b) Control rats vs. diabetic rats. (c) Diabetic rats vs. Rosmarinic acid treated diabetic rats. (d) Rosmarinic acid treated diabetic rats vs. Metformin treated diabetic rats.
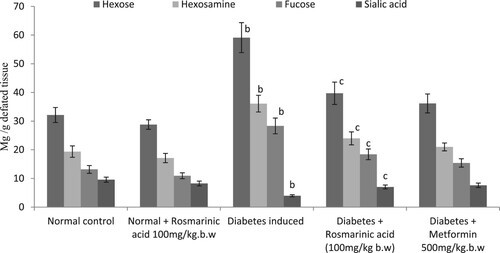
Figure 4. Changes in the levels of kidney glycoproteins in control and experimental animals. Values are given as mean ± SD for six animals in each group. Values are considered significantly different at P < 0.05 with post hoc LSD test *P < 0.05. (a) Control vs. Rosmarinic acid alone treated control rats. (b) Control rats vs. diabetic rats. (c) Diabetic rats vs. Rosmarinic acid treated diabetic rats. (d) Rosmarinic acid treated diabetic rats vs. Metformin treated diabetic rats.