Figures & data
Fig. 1 Conceptualization of iPRACTISE as a control theory-inspired cruise control system that can be used by students, instructors, and program administrators to recommend optimal training pathways to minimize discrepancies between each student’s current and target ability levels.
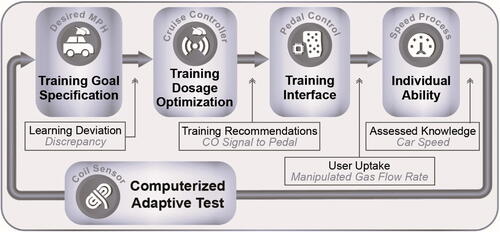
Fig. 2 Summary of survey questions designed to help users specify their training goals and preferences; (B) a sample assessment question and progression of a hypothetical student’s estimated ability level during the assessment.
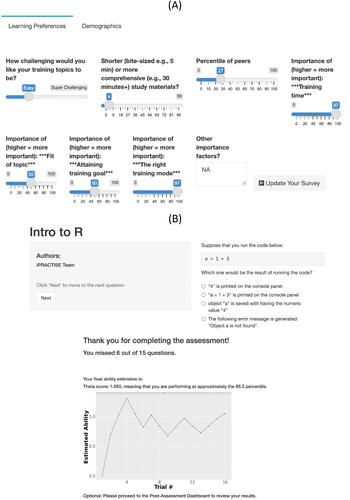
Fig. 3 Personalized post-assessment dashboard for a hypothetical student on Introduction to R, with: (A) a summary of the questions missed by the student and the correct responses; and (B) training materials ranked in descending order of fit to the student, with fit information across attributes (in terms of difficulty level, method of delivery, and estimated training time).
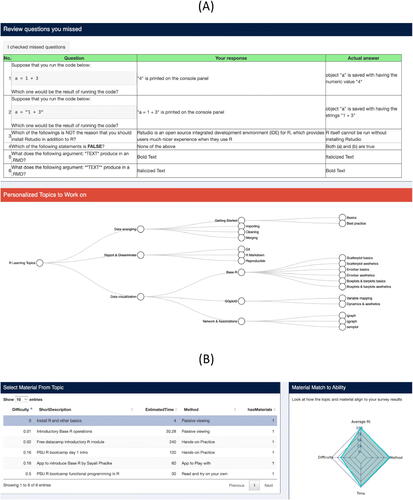
Fig. 4 (A) Scatterplot of the updated item easiness estimates compared to item easiness used initially in the BOAST adaptive test, which consisted of a combination of estimates from the calibration sample and instructor’s expert ratings; and (B) histogram plots showing the distributions of standard errors (SEs) in ability estimates in the adaptive as compared to the calibration groups. Students who were exposed to a similar range of number of items (between 8 and 10 items) across the two test groups were highlighted with a darker shade, and their respective averages in SE estimates are depicted in text.
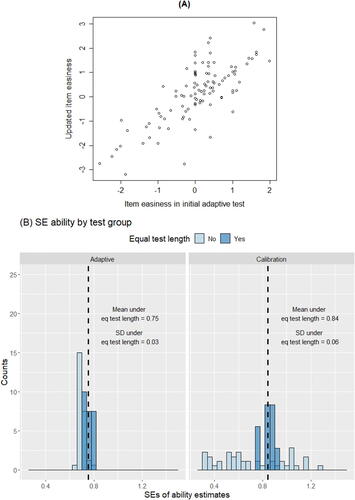
Fig. 5 Screenshots of selected instructor functionalities in iPRACTISE, including: (A) a dashboard for viewing students’ progress; and (B) an assessment portal for browsing through and selecting existing assessment items from the test archive, as well as adding new items.
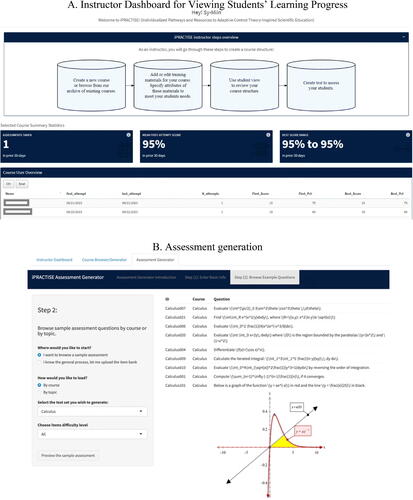
Table 1 Comparisons of fit across several alternative Item Response Theory models of individuals’ response patterns in the Introduction to R course.
Table 2 Summary statistics for the rated importance (on a scale of 0–100) of attributes hypothesized to help participants select training materials.
Table 3 Summary statistics for the rated usefulness (on a scale of 0–100) of selected iPRACTISE features.
Data Availability Statement
Data analysis scripts and de-identified data for which students have given consent to share their data to enhance the designs, developments, and delivery of statistics, mathematics, and data science education are openly available in the Open Science Framework at osf.io/vr43t. Other historical data collected in previous classes and used for calibration of assessment items within iPRACTISE are not shared when student consent was not obtained previously and the data could contain identifying information.