Figures & data
Figure 1. Distribution of studies in fermented foods by NMR.
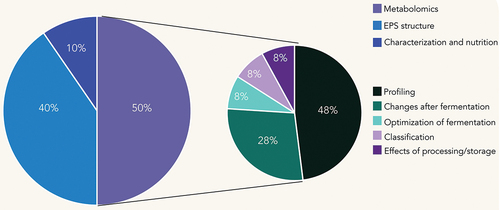
Table 1. 1D and 2D NMR studies in fermented foods.
Figure 2. Representative chemical shifts of HoPs produced by LAB.
a: carbon signals clustered around this chemical shift zone
b: AC amorphous cellulose
c: CC crystalline cellulose
d: Characteristic signal from levans
e: Range of ppm where different authors found this signal.
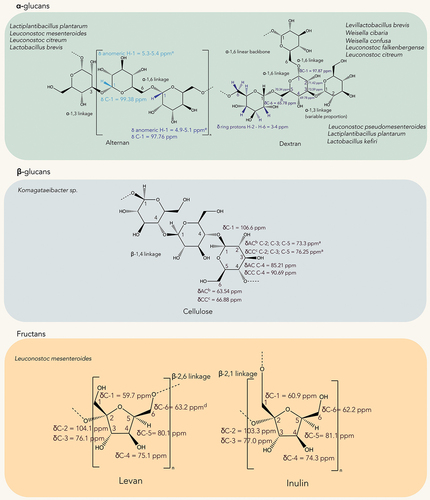
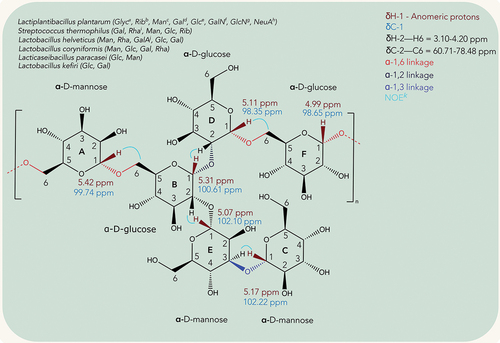
Figure 3. Representative chemical shifts of HePs produced by LAB.
aGylc: glycerol
bRib: ribitol
cMan: mannose
dGal: galactose
eGlc: glucose
fGalN: galactosamine
gGlcN: glucosamine
hNeuA: neuraminic acid
iRha: rhamnose
jGalA: galacturonic acid
kNOE: Nuclear Overhauser Effect