Figures & data
Figure 1. Mean specific heat of skipjack loin meat, red meat, viscera, and backbone over the temperature range of 10–105°C n = 6. Standard deviations for this data were too small to be shown on plot.
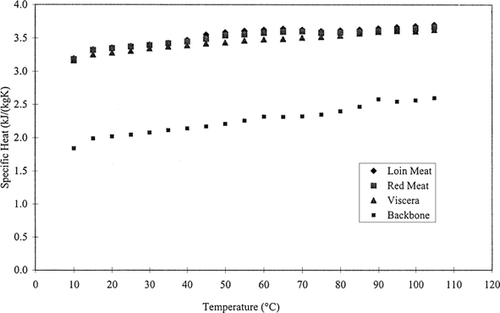
Table 1. Comparison of Specific Heat of Loin Meat of Skipjack and Albacore Muscle
Table 2. Protein Denaturation Temperature
Figure 2. DSC thermogram for protein denaturation. Peaks 1, 2, and 3 represent the three protein denaturation temperatures discussed in text.
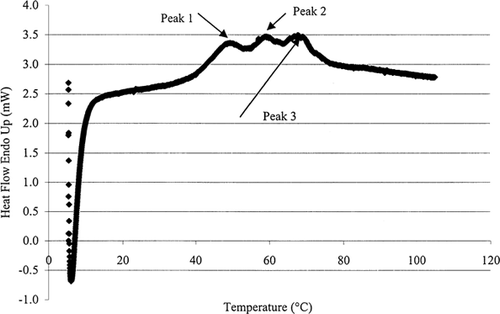
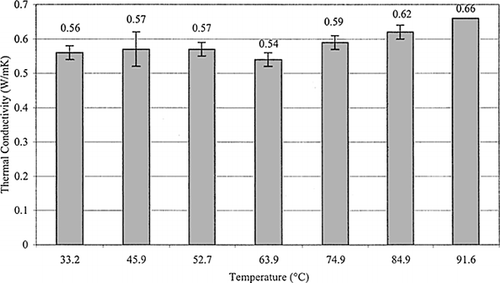
Figure 3. Thermal conductivity of skipjack tuna loin muscle at various temperatures (n = 10 for all measurement except at a temperature of 91.6°C where n = 1).