Figures & data
Table 1 Some physical characteristics of ABF seeds
Figure 1. Water absorption characteristics curves for T. africana seeds at various soaking temperatures.
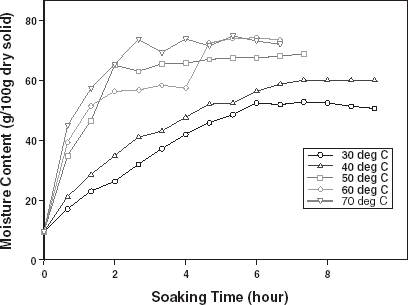
Table 2 Original and linear forms of the water absorption models
Table 3 Regression coefficients in the water absorption models
Table 4 Temperature dependence of the absorption rate constants
Table 5 Published water absorption parameters for some cereals and legumes
Figure 2. Temperature dependence of the absorption rate constants.
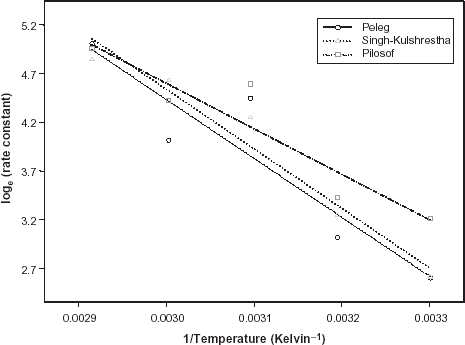
Table 6 Estimates of equilibrium moisture (M e ) and time to reach equilibrium (t e )
Table 7 Chi-square and root mean square deviation (RMSD) values
Figure 3. Comparism of the predicted moisture contents (M and M − M o ) with the experimental data at 30oC.
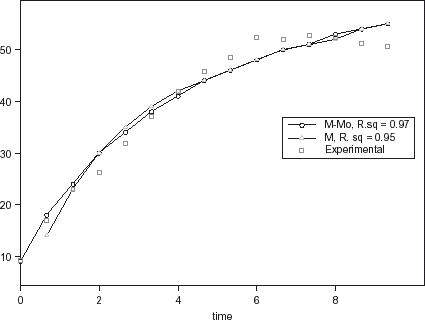
Figure 4. Experimental and predicted moisture contents at 30oC.
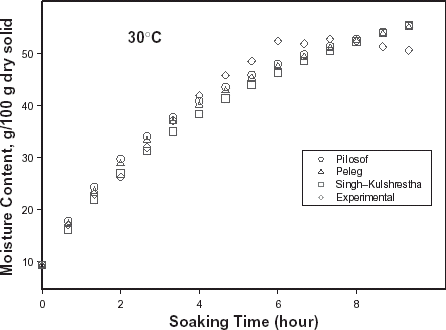
Figure 5. Experimental and predicted moisture contents at 40oC.
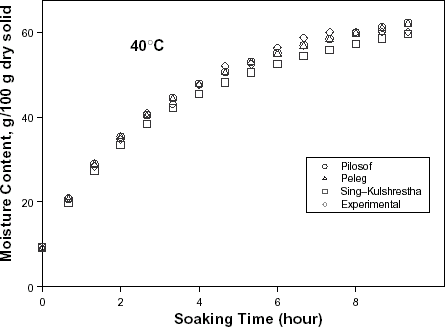
Figure 6. Experimental and predicted moisture contents at 50oC.
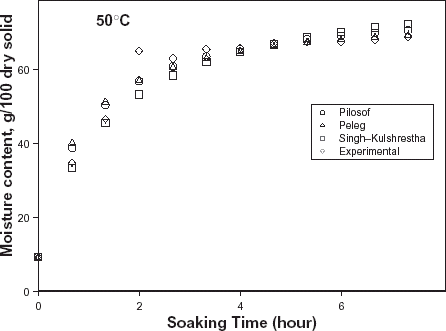
Figure 7. Experimental and predicted moisture contents at 60oC.
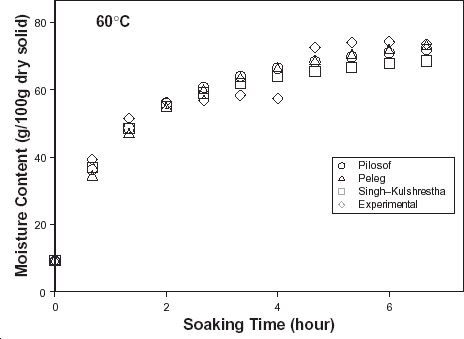
Figure 8. Experimental and predicted moisture contents at 70oC.
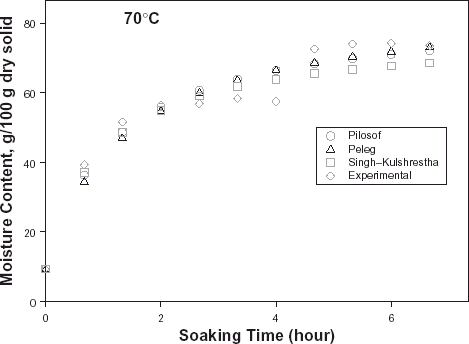
Figure 9. Residual plot of moisture content based on Pilosof's absorption model.
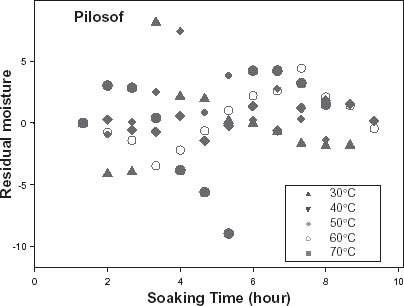
Figure 10. Residual plot of moisture content based on Peleg's absorption model.
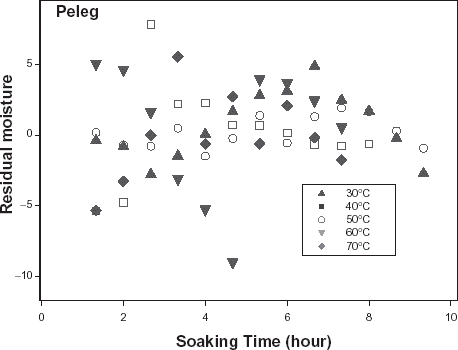
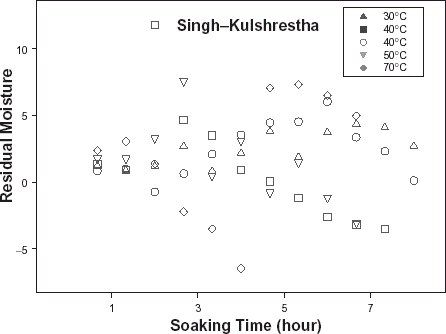
Figure 11. Residual plot of moisture content based on Singh–Kulshrestha absorption model.