
Figures & data
Table 1 Descriptive and training characteristics of the 12 participants (mean ± SD)
Fig. 1 Schematic of the experimental trial day. CHO = carbohydrate, RPE = rating of perceived exertion, GI = gastrointestinal
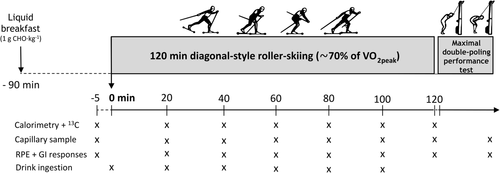
Fig. 2 Mean ± SD changes in δ 13CO2 in expired CO2 during the 120-min submaximal exercise bout. cSignificant difference between CHO-HG and PLA (P < 0.0001; n = 12)
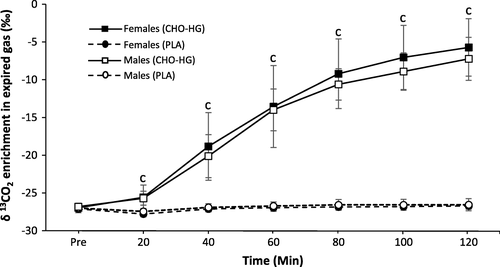
Table 2 Mean ± SD RER and substrate oxidation (g min− 1·kg LBM− 1·10− 2) during the second hour of submaximal exercise (60–120 min)
Fig. 3 The relative contributions of fat, endogenous carbohydrate and exogenous carbohydrate oxidation to the total energy yield during the second hour of exercise (60–120 min). PLA, placebo trial; CHO-HG, carbohydrate trial. Significant difference between CHO-HG and PLA (P < 0.05) for afemales (n = 6) and bmales (n = 6) and call athletes (n = 12)
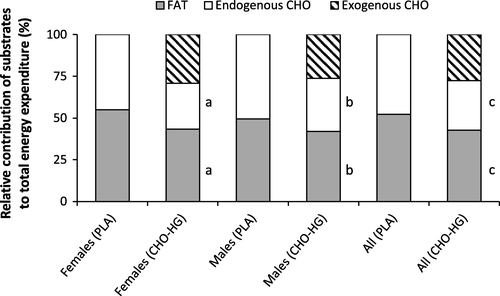
Fig. 4 Mean ± SD blood glucose (a) and lactate (b) concentrations. Significant difference between CHO-HG and PLA for afemales (n = 6) and bmales (n = 6) and call athletes (n = 12)
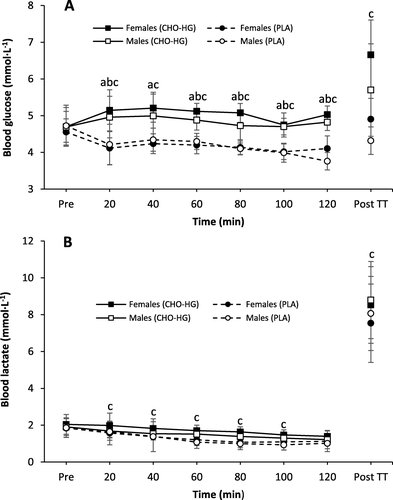
Table 3 Ratings of perceived exertion (RPE) and perceptions of gastrointestinal symptoms during the 120-min submaximal exercise (n = 12)
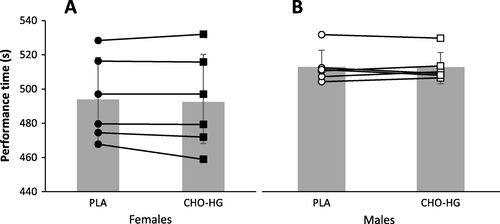
Fig. 5 Mean ± SD time taken to complete the 2000-m TT for females (a) and 2400-m TT for males (b). PLA, placebo trial; CHO-HG, carbohydrate trial
rssn_a_12130128_sm0001.pdf
Download PDF (104.6 KB)rssn_a_12130128_sm0002.docx
Download MS Word (14 KB)Availability of data and materials
All data generated or analyzed during this study are included in this published article (and its supplementary information files).