
Figures & data
Figure 1 Schematic diagram of research method.
Abbreviations: TBL, team-based learning; LBL, lecture-based learning.
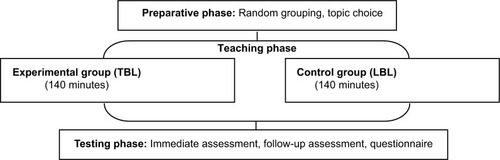
Figure 2 Schematic diagram of team-based learning method.
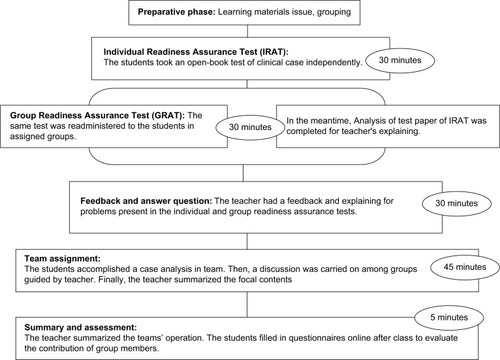
Table 1 Baseline student characteristics
Table 2 IRAT-baseline, GRAT, ITT1, and ITT2 scores between two groups
Table 3 IRAT-baseline, ITT1, and ITT2 scores in each subgroups of TBL
Table 4 Students’ feedback on the teaching model
Table 5 Learning times spent between the two groups