
Figures & data
Figure 1 Study flowchart.
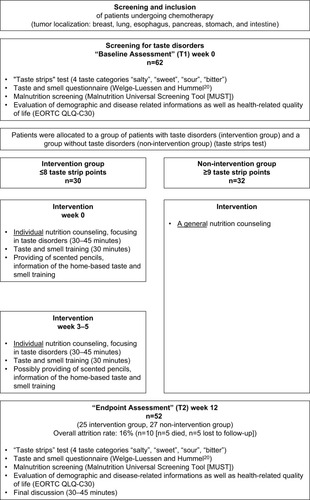
Table 1 Baseline characteristics
Table 2 Changes in the rate of improvement by two TS points and median TS points
Figure 2 Changes in median TS points.
Abbreviation: TS, taste strip.
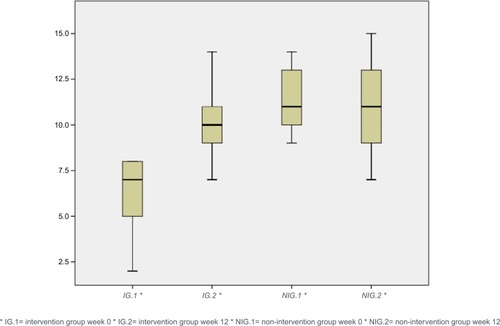
Table 3 Change in median TS points in taste categories
Table 4 Rate of patients of the intervention group and the non-intervention group in selected items of the taste and smell questionnaire in week 0
Figure S1 Malnutrition risk according to group and tumor type at baseline and changes over time.
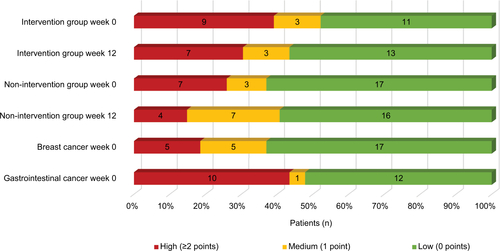
Table S1 Rate of patients of the intervention group and the non-intervention group changes over time in items of the taste and smell questionnaire
Table S2 Rate of patients with 2 and ≥3 points of the intervention group changes over time in items of the taste and smell questionnaire
Data availability
Whether the authors intend to share individual deidentified participant data? No.
What specific data they intend to share? Not available.
What other study-related documents will be made available? Not available.
How the data will be accessible? Not applicable.
When and for how long they will be made available? Not applicable.