Figures & data
Table 1 Sociodemographic characteristics and COPD prevalence stratified by site
Figure 1 Prevalence of COPD per city using the lower limit of normal (LLN) method of diagnosis with Global Lung Function Initiative (GLI) mixed ethnic population, presented as overall and stratified by sex.
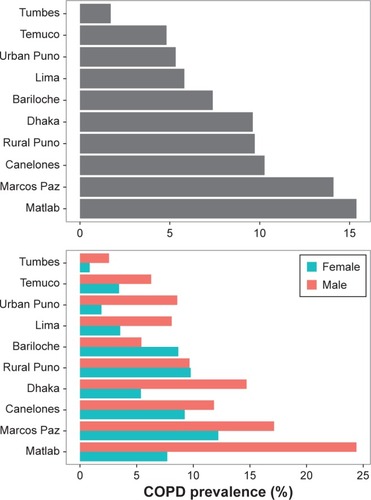
Figure 2 Pre-bronchodilator FEV1/FVC Z-score using Global Lung Function Initiative (GLI) mixed ethnic population, stratified by age and sex.
Notes: Age is stratified into four categories. Males are represented by red box plots and females by green, in ten panels each representing an individual site.
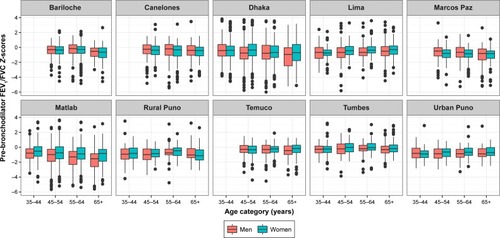
Figure 3 Mean pre-bronchodilator FEV1 and FEV1/FVC Z-score using Global Lung Function Initiative (GLI) mixed ethnic population, by elevation in meters and site.
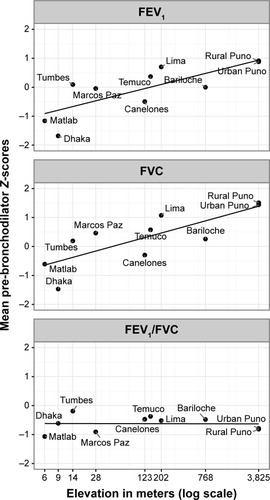
Table 2 Unadjusted and adjusted alternating logistic regression models for COPD using the lower limit of normal (LLN) method of diagnosis with Global Lung Function Initiative (GLI) mixed ethnic population, coefficients reported as odds ratios
Figure 4 Odds ratio of COPD by socioeconomic status composite index (SES index), secondary education or higher (below secondary as reference), greater than or equal to median household size of 4 (below as reference), and monthly household income (change per category).
Abbreviation: SES, socioeconomic status.
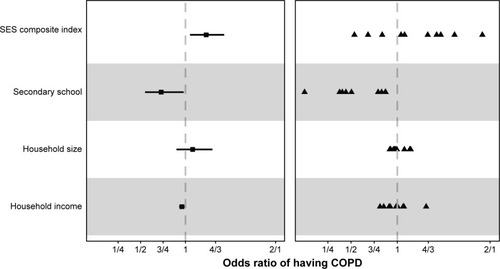
Table 3 Unadjusted and adjusted random effects linear regression models for pre-bronchodilator FEV1/FVC Z-score using Global Lung Function Initiative (GLI) mixed ethnic population
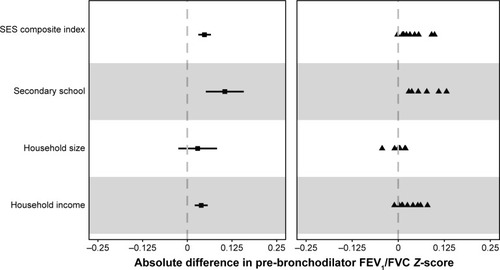
Figure 5 Absolute difference in pre-bronchodilator FEV1/FVC Z-score by socioeconomic status composite index (SES index), secondary education or higher (below secondary as reference), greater than or equal to household size of 4 (below as reference), and monthly household income (change per category).
Abbreviation: SES, socioeconomic status.