Figures & data
Table 1 Demographic and baseline characteristics
Table 2 Adverse events following a single oral dose of HMS5552 in healthy subjects
Table 3 Summary of geometric mean (SD) pharmacokinetic parameters of HMS5552
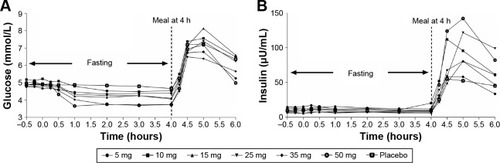
Figure 1 Mean HMS5552 plasma concentration (ng/mL) versus time after a single oral administration in healthy subjects at six different doses (n=8 per dose group).
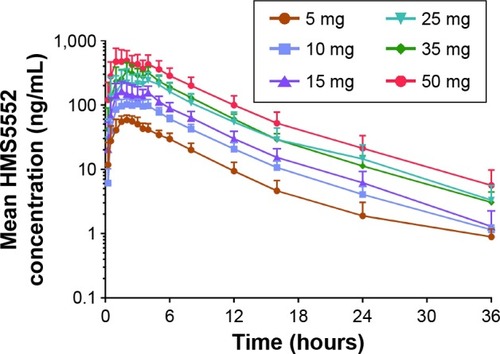
Figure 2 HMS5552 and its major metabolites in human plasma and urine.
Notes: HMS5552 and its major metabolites in human plasma (A) and urine (B) at different time points. Time point 0~24 hours in plasma is the area under the curve pooling sample.
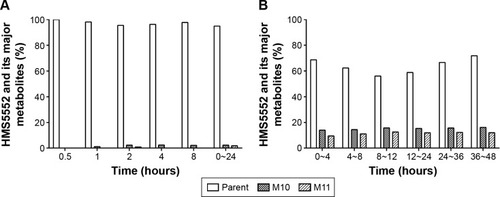
Figure 3 Effect of HMS5552 on mean glucose and insulin concentrations during fasting and after a standardized meal.
Notes: Effect of HMS5552 on mean glucose (A) and insulin (B) concentrations at specified times (-0.5, -0.25, 0, 0.25, 0.5, 1, 2, 3, 4, 4.25, 4.5, 5, and 6 hours [h]) after a single oral administration of HMS5552 at various doses.