Figures & data
Table 1 Description of selected human anticancer drug targets used to generate the structure-based pharmacophores in this study
Table 2 Summary of performances of pharmacophore models in virtual screening study
Figure 1 A pharmacophore model used to screen for potential active compounds against the 1IEP target.
Abbreviations: HBDs, H-bond donors; HBAs, H-bond acceptors.
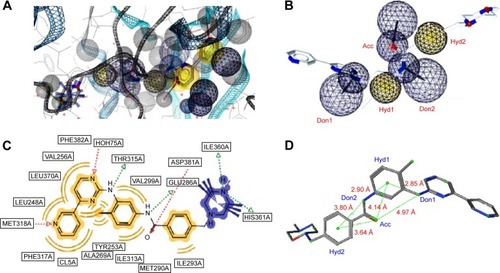
Figure 2 Two sets of combinations of high-performance pharmacophore models for the 3PE1 target.
Abbreviations: HBDs, H-bond donors; HBAs, H-bond acceptors.
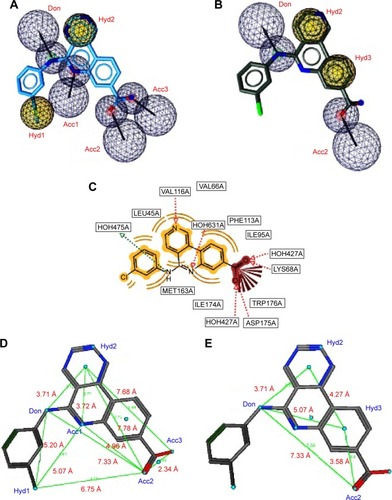
Figure 3 A pharmacophore model used to screen for potential active compounds against the 3PE2 target.
Abbreviations: HBDs, H-bond donors; HBAs, H-bond acceptors; FPs, false positives.
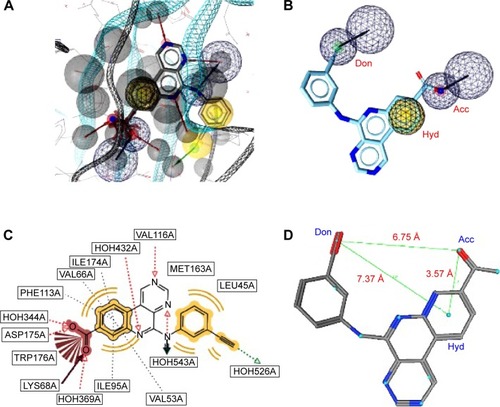
Figure 4 A pharmacophore model used to screen for potential active compounds against the 4ACM target.
Abbreviations: HBDs, H-bond donors; HBAs, H-bond acceptors; GH, Güner–Henry.
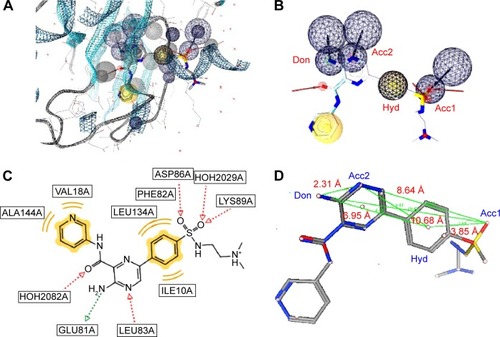
Figure 5 The ROC curve for the 3PE1-I pharmacophore model.
Abbreviation: ROC, receiver operating characteristic.
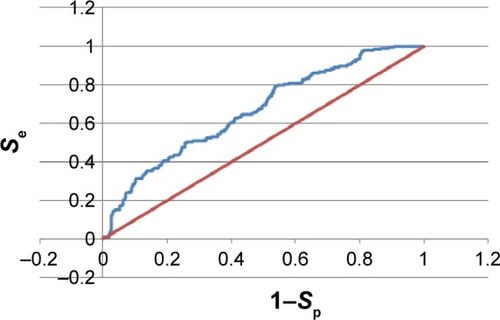
Figure 6 ROC curves for the 4BBG pharmacophore models.
Abbreviation: ROC, receiver operating characteristic.
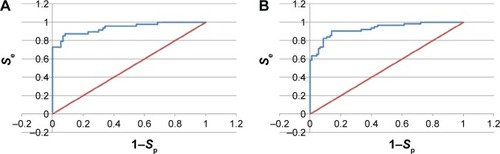
Table 3 Comparison of virtual screening results (number of compounds in hit list and hit rates) for the AfroCancer and NPACT datasets of the pharmacophore models generated
Figure 7 Enrichment curves obtained by screening the database compounds consisting of the AfroCancer database (blue) and NPACT database (green), using the 4ACM pharmacophore query features.
Abbreviation: NPACT, Naturally Occurring Plant-based Anticancer Compound-Activity-Target.
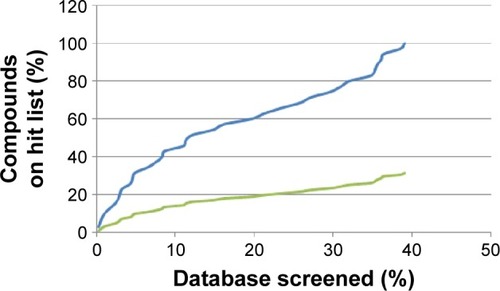
Figure 8 Psoralen substructure responsible for chromosome damage predicted as CERTAIN for two compounds from the AfroCancer dataset.
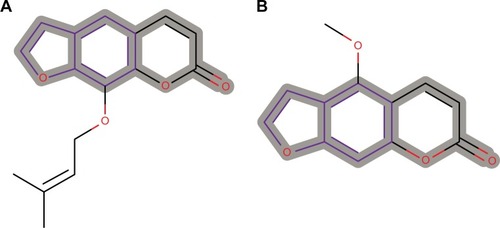
Table 4 Summary of toxicity predictions for AfroCancer and NPACT datasets
Figure 9 Bar charts showing the distribution of toxicity predictions per likelihood.
Abbreviation: NPACT, Naturally Occurring Plant-based Anticancer Compound-Activity-Target.
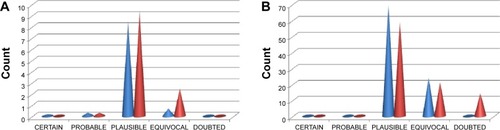
Figure 10 A PCA plot showing the comparison of the chemical space defined by the NPs in the AfroCancer (red) datasets and the chemical space represented by NPs in the NPACT (cyan) datasets, with the first three principal components projected, respectively, in the x, y, and z directions of space.
Abbreviations: PCA, principal component analysis; NPs, natural products; Var, variance.
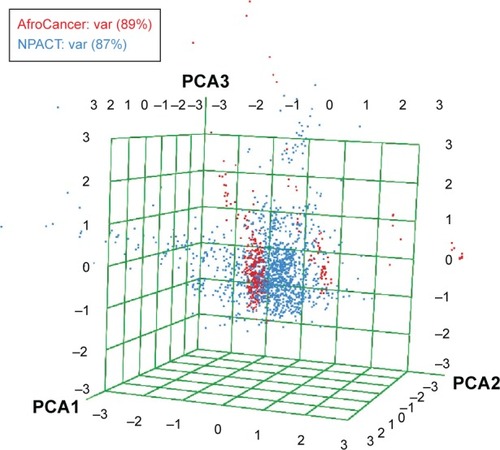
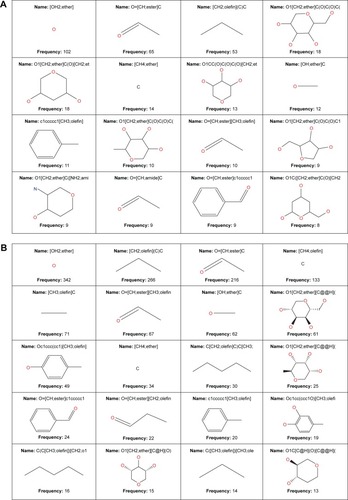
Figure 11 MCSS panel in (A) AfroCancer and (B) NPACT, featuring the most common substructures included in the databases.