Figures & data
Table 1 qRT-PCR Primer Sequences
Figure 1 UCG alleviated the symptoms of ESRD rats.
Notes: (A) The kidney of rats after different treatment. (B) Changes in body weight in rats. (C) HE staining was used to observe the morphology of renal tissue in rats. (D) Masson staining was applied to detect the expression of collagen in the renal tissue of rats. (E) The concentrations of BUN, Scr, and UPr in rats were determined by ELISA, and Ccr was calculated. (F) The concentration of inflammatory cytokines in the serum of rats was tested by ELISA. The magnification is 400 times, scale bar = 25 μm; *P<0.05 compared with the Sham group. #P<0.05 compared with the Model group. &P<0.05 compared with the PD group.
Abbreviations: ESRD, end-stage renal disease; UCG, Uremic Clearance Granules; Scr, serum creatinine; Ccr, creatinine clearance rate; HE, hematoxylin-eosin; ELISA, enzyme-linked immunosorbent assay; BUN, urea nitrogen; UPr, urinary protein; CRE, creatinine.
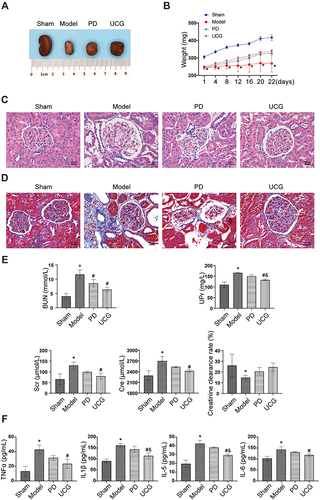
Figure 2 UCG inhibited NF-κB and MAPK signaling pathways in rat kidneys.
Notes: (A) The relative expression levels of P65 and P38 were detected by qRT-PCR. (B) The P65, P38, p-P65, and p-P38 expressions were measured by WB. (C) IHC examined the expression levels of P65 and P38. The magnification is 400 times, scale bar = 25 μm; *P<0.05 compared with the Sham group. #P<0.05 compared with the Model group. &P<0.05 compared with the PD group.
Abbreviations: UCG, Uremic Clearance Granules; MAPK, mitogen-activated kinase; NF-κB, nuclear factor kappa B; HE, hematoxylin-eosin; WB, Western blot.
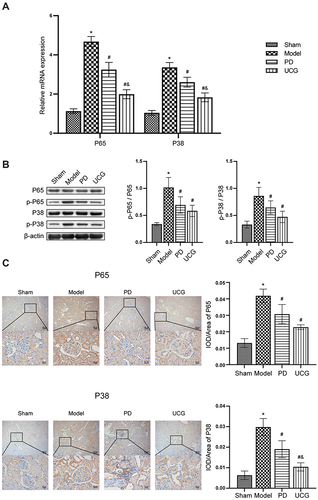
Figure 3 UCG inhibited NF-κB and MAPK signaling pathways in colon tissues of rats.
Notes: (A) The relative expression levels of P65 and P38 were detected by qRT-PCR. (B) The P65, P38, p-P65, and p-P38 expressions were measured by WB. (C) IHC examined the expression levels of P65 and P38. The magnification is 400 times, scale bar = 25 μm; *P<0.05 compared with the Sham group. #P<0.05 compared with the Model group. &P<0.05 compared with the PD group.
Abbreviations: UCG, Uremic Clearance Granules; MAPK, mitogen-activated kinase; NF-κB, nuclear factor kappa B; WB, Western blot.
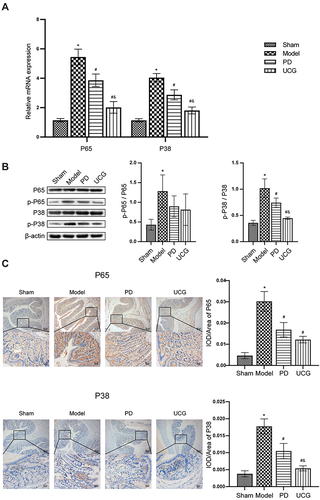
Figure 4 UCG improved the relative abundance of some gut microbiota in ESRD rats receiving PD.
Notes: (A) Differences in the number of ASV in the four groups. (B) The relative abundance of the 20 genera with the largest relative abundance. (C) Rarefaction curve of Chao1 index. (D) Alpha diversity in four groups.
Abbreviations: ESRD, end-stage renal disease; UCG, Uremic Clearance Granules.
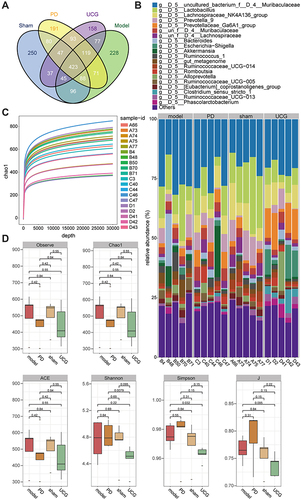
Figure 5 UCG improved the relative abundance of some gut microbiota in ESRD rats (β diversity).
Notes: (A) Anosim detected differences in beta diversity among the four groups. (B) The abundance difference of the 20 genera with the largest relative abundance. (C) The relative abundance of uncultured_Bacterium_f_D_4_Muribaculaceae and Lachnospiraceae_NK4A136_group.
Abbreviation: UCG, Uremic Clearance Granules.
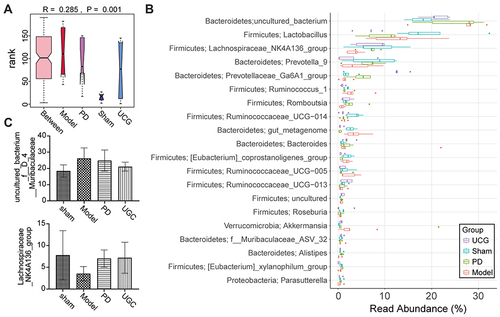
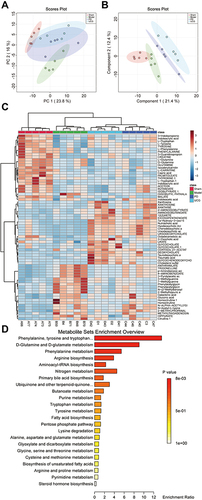
Figure 6 UCG improved the metabolic level of ESRD rats.
Notes: (A) PCA performed dimensionality reduction analysis on the metabolome data. (B) PLS-DA was used to analyze the metabolome data. (C) The expression of 80 differentially expressed metabolites in 4 groups. (D) KEGG was applied for functional annotation of differentially expressed metabolites.
Abbreviations: ESRD, end-stage renal disease; UCG, Uremic Clearance Granules; KEGG, Kyoto Encyclopedia of Genes and Genomes.