Figures & data
Figure 1 Structure and effects of 2-MCA on cell morphology and growth in SK-HEP-1 cells.
Notes: Structure (A) and effects of 2-MCA on cell morphology (B–D) and growth (E) in SK-HEP-1 cells. (B–D) Effect of 2-MCA on cell morphology. Cells were treated with 0 µM (B), 10 µM (C), and 40 µM (D) of 2-MCA, respectively, for 24 h. When SK-Hep-1 cells were exposed to 10 µM of 2-MCA, vacuolation of cells occurred. At 40 µM of 2-MCA, plasma membrane blebbing, cell shrinkage, and cell detachment were observed. (E) 2-MCA-inhibited proliferation. SK-Hep-1 cells were treated with 2-MCA at the indicated conditions. Cell proliferation-inhibitory activity was evaluated by the XTT assay. Data are expressed as means ± standard error of mean, n=5. *Indicates a significant difference (P<0.05) from control.
Abbreviations: 2-MCA, 2-methoxycinnamaldehyde; h, hours.
Abbreviations: 2-MCA, 2-methoxycinnamaldehyde; h, hours.
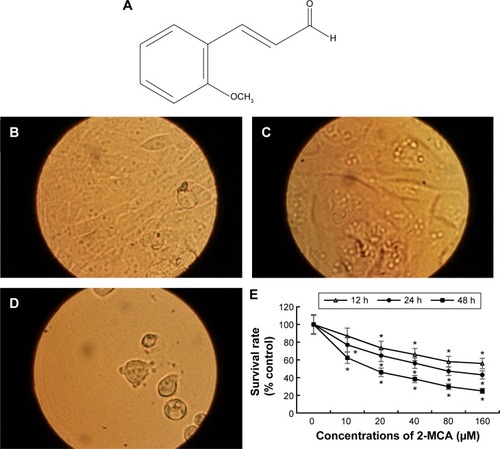
Figure 2 2-MCA-induced nuclear fragmentation in SK-Hep-1 cells.
Notes: (A and B) Acridine orange staining: cells were treated with 2-MCA 0 µM and 10 µM, respectively, for 24 h, then stained with acridine orange. Orange vacuoles in cells showed that they were acidic. (A) Control group; (B) test group treated with 10 µM 2-MCA in which nuclear fragmentation and lysosomal vacuolation were observed. (C and D) Comet assay: cells were embedded in agarose and DNA was then unwound in an alkaline solution and subjected to electrophoresis. Cells were then stained with DAPI and examined under a fluorescent microscope. (C) and (D) Representative SK-Hep-1 cells treated with 0 µM and 10 µM of 2-MCA, respectively for 48 h. (E) and (F) Tail intensity and moment of SK-Hep-1 cells treated with 0 µM and 10 µM of 2-MCA, respectively for 48 h. Data are expressed as means ± standard error of mean, n=5. *Indicates a significant difference (P<0.05) from control.
Abbreviations: 2-MCA, 2-methoxycinnamaldehyde; h, hours.
Abbreviations: 2-MCA, 2-methoxycinnamaldehyde; h, hours.
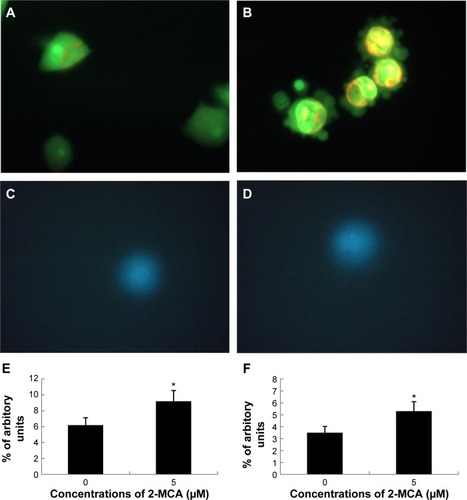
Figure 3 2-MCA increased VAC in SK-Hep-1 cells.
Notes: SK-Hep-1 cells were treated with 0 µM, 15 µM, or 30 µM of 2-MCA for 24 h, and then stained with neutral red. (A) Control group: there were no obvious vacuoles in cells. (B) and (C) SK-Hep-1 cells treated with 15 µM and 30 µM of 2-MCA, respectively. The acidic red vacuoles in cells were observed. (D) 2-MCA increased VAC in a dose-dependent manner. SK-Hep-1 cells were incubated with the indicated concentration of 2-MCA for 24 h, and data were analyzed with spectrophotometer. The images were obtained by using a light microscope with a yellow filter inserted in the light path. Data are expressed as means ± standard error of mean, n=5. *Indicates a significant difference (P<0.05) from control.
Abbreviations: 2-MCA, 2-methoxycinnamaldehyde; VAC, volume of acidic compartment; h, hours.
Abbreviations: 2-MCA, 2-methoxycinnamaldehyde; VAC, volume of acidic compartment; h, hours.
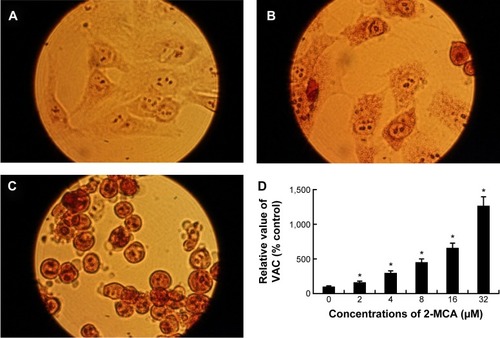
Figure 4 Flow cytometric analysis of 2-MCA-treated SK-Hep-1 cells.
Notes: (A) SK-Hep-1 cells were treated with the indicated concentrations of 2-MCA for 24 h. The induction of apoptosis was determined by PI staining and analyzed using CyFlow SL Flow Cytometer. (B) Data are expressed as means ± standard error of mean, n = 5. *Indicates a significant difference (P<0.05) from control.
Abbreviations: 2-MCA, 2-methoxycinnamaldehyde; h, hours; PI, propidium iodide.
Abbreviations: 2-MCA, 2-methoxycinnamaldehyde; h, hours; PI, propidium iodide.
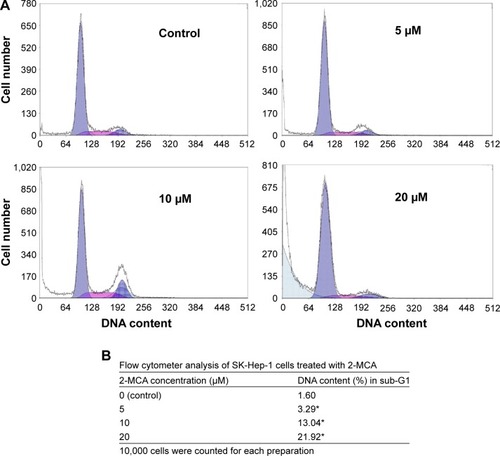
Figure 5 2-MCA induced apoptosis through the mitochondrial pathway in SK-Hep-1 cells.
Notes: (A and B) Cells were treated with 0 µM and 20 µM of 2-MCA, respectively, for 48 h, and ∆Ψm was analyzed by JC-1 using fluorescent microscopy (A) depicts control cells with intact mitochondria fluorescencing red; (B) shows most 2-MCA-treated cells fluorescencing green, suggesting the loss of ∆Ψm. (C) Cells were treated with the indicated concentrations of 2-MCA for 12 h and ∆Ψm was analyzed by JC-1 using spectrophotometer. (D) Activations of caspase-3 and caspase-9. Cells were treated with the indicated concentrations of 2-MCA for 24 h, and activities of caspase-3 and caspase-9 were determined fluorometrically using fluorescent-labeled synthetic substrates. Data are expressed as means ± standard error of mean, n=5. *Indicates a significant difference (P<0.05) from control.
Abbreviations: 2-MCA, 2-methoxycinnamaldehyde; h, hours.
Abbreviations: 2-MCA, 2-methoxycinnamaldehyde; h, hours.
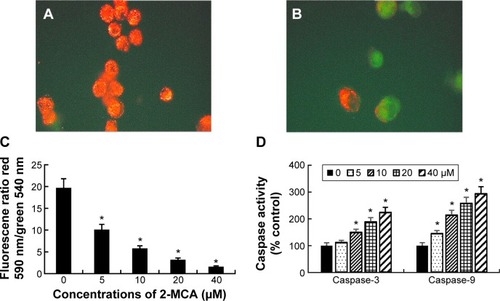
Figure 6 Inhibition of SK-Hep-1 topo I and II activities by 2-MCA.
Notes: (A) 2-MCA inhibited topo I activity in SK-Hep-1 cells. Nuclear proteins from SK-Hep-1 cells were added to a specific topo I reaction mixture in the presence of the indicated concentrations of 2-MCA (lanes 3–5) or 60 µM CPT (lane 6) or the vehicle (1% DMSO, lane 2). Lane 1: pUC19 DNA only. (B) 2-MCA inhibits topo II activity in SK-Hep-1 cells. DNA relaxation assay (upper part) and decatenation assay (lower part): nuclear proteins from SK-Hep1 cells were added to a specific topo II reaction mixture in the presence of the indicated concentrations of 2-MCA (lanes 3–5) or 60 µM VP-16, a specific topo II inhibitor (lane 6), or the vehicle (1% DMSO, lane 2). (Lane 1) Supercoiled pUC19 DNA (upper part) or kDNA (lower part) only. kDNA is a large network of plasmids, when it is analyzed by gel electrophoresis, it penetrates only slightly into agarose gel (result not shown). Upon decatenation by topo II, mini circles monomers of DNA are formed (lower part, lanes 2–6).
Abbreviations: 2-MCA, 2-methoxycinnamaldehyde; CPT, camptothecin; DMSO, dimethyl sulfoxide.
Abbreviations: 2-MCA, 2-methoxycinnamaldehyde; CPT, camptothecin; DMSO, dimethyl sulfoxide.
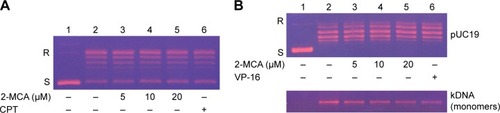
Figure 7 2-MCA-inhibited DNA-binding activity of NF-κB and expressions of COX-2 and PGE2 in SK-Hep-1 cells.
Notes: SK-Hep-1 cells were incubated with or without the indicated concentrations of 2-MCA for 24 h. After incubation, nuclear extracts and culture media were analyzed for NF-κB DNA-binding activity (A), COX-2 (B), and PGE2 (C) expressions, respectively. Data are expressed as means ± standard error of mean, n=5. *Indicates a significant difference (P<0.05) from control.
Abbreviations: 2-MCA, 2-methoxycinnamaldehyde; NF-κB, nuclear factor κB; COX-2, cyclooxygenase-2; PGE2, prostaglandin E2; h, hours.
Abbreviations: 2-MCA, 2-methoxycinnamaldehyde; NF-κB, nuclear factor κB; COX-2, cyclooxygenase-2; PGE2, prostaglandin E2; h, hours.
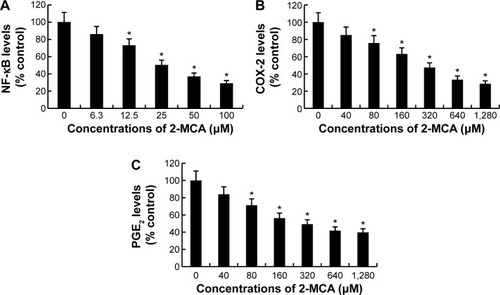
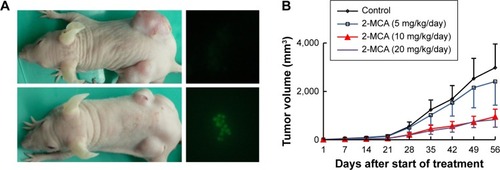
Figure 8 2-MCA suppressed growth and induced apoptosis in SK-Hep-1 xenograft.
Notes: Animals bearing preestablished tumors (n=8 per group) were injected intratumorally with the indicated concentration of 2-MCA. During the 56-day of 2-MCA treatment, tumor volumes were monitored using calipers and apoptosis was assessed by TUNEL assay. (A) Left: representative tumor-possessing nude mice from the control (upper) and 10 mg/kg/d of 2-MCA-treated (lower) groups. (A) Right: 2-MCA-induced apoptosis in SK-Hep-1 xenograft by TUNEL assay. Representative TUNEL assay of tumors from the control (upper) and 10 mg/kg/d of 2-MCA-treated (lower) groups. (B) Mean of tumor volume measured at the indicated number of days after start of treatment. Data are expressed as means ± standard error of mean, n=8.
Abbreviation: 2-MCA, 2-methoxycinnamaldehyde.
Abbreviation: 2-MCA, 2-methoxycinnamaldehyde.