Figures & data
Figure 1 Schematic structure of the F-CONH-PEG-NH-Chol conjugated Dox liposomes.
Abbreviations: Dox, doxorubicin; HSPC, hydrogenated soybean phosphatidylcholine; F-CONH-PEG-NH-Chol, folate-CONH-PEG-NH-Cholesterol; mDSPE-PEG, poly(ethylene glycol)-distearoylphosphatidylethanolamine-maleimide.
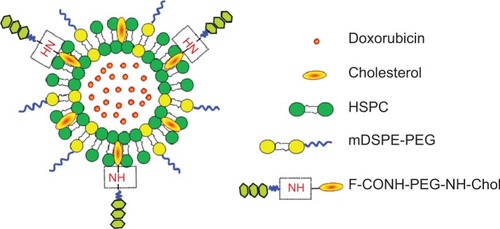
Figure 2 The synthesis of F-CONH-PEG-NH-Chol (folate-CONH-PEG-NH-Cholesterol).
Notes: Folate was linked to PEG-bis-amine by an amide bond first. Then cholesterol–OTs was reacted with folate-CONH-PEG-NH2 to form folate-CONH-PEG-NH-Chol by C-N bond connection.
Abbreviation: cholesterol-OTs, cholesterol-p-toluenesulfonate.
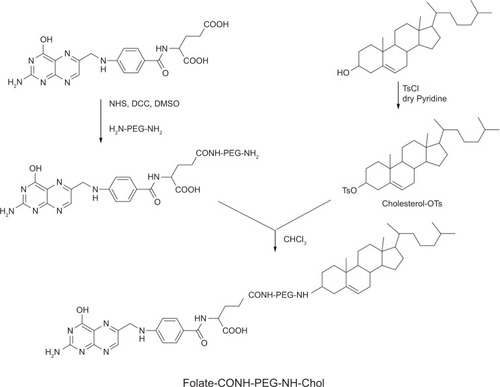
Table 1 Particle size, zeta potential, and entrapment efficiency of D-L and F-D-L
Figure 3 The physical stability test of F-CONH-PEG-NH-Chol and F-CONH-PEG-CONH-Chol liposomes.
Notes: Both liposomes were stored at 4°C for 3 months after preparation and particle size and drug encapsulation were determined every 2 weeks. (A) Particles size changes with time at 4°C. (B) Dox content changes with time at 4°C. Data are expressed as the mean ± SD (n=3). **P<0.01.
Abbreviations: Dox, doxorubicin; SD, standard deviation; F-CONH-PEG-NH-Chol, folate-CONH-PEG-NH-Cholesterol; F-CONH-PEG-CONH-Chol, folate-CONH-PEG-CONH-Cholesterol.
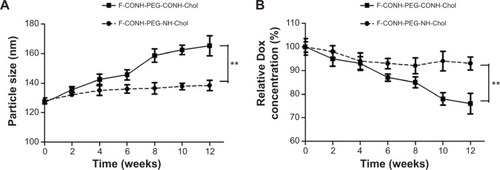
Figure 4 Uptake of F-Calcein-L and Calcein-L by HeLa, KB and SMMC-7721 cells.
Notes: The cells were cultured with Calcein-L, F-Calcein-L and F-Calcein-L pretreated with 1 mM free folic acid (F-Cal-L + folate) for 1 hour and the uptake was assayed by both the fluorescence microscopy (×100) and the FACS. The images were taken in bright fields or under fluorescence for equal exposure time. The FACS measured 2×10⁶ cells for each sample and the blank means no drug was added and was used as a control. Note when cells were pretreated with folic acid, the uptake of F-Calcein-L was inhibited.
Abbreviation: F-Calcein-L, folate receptor targeted calcein liposomes; FACS, fluorescence activated cell sorter.
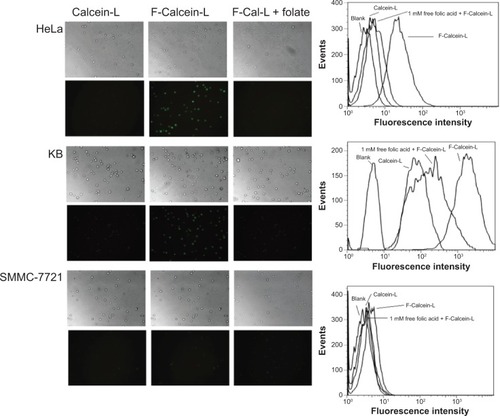
Table 2 IC50 of Dox formulation in HeLa and KB cells
Table 3 Plasma pharmacokinetic analysis
Figure 5 F-D-L, D-L and free Dox concentrations in mouse plasma and liver.
Notes: (A) Pharmacokinetics of F-D-L, D-L and free Dox in the mouse plasma. (B) Dox distribution in the mouse livers administered with F-D-L, D-L and free Dox (n=6). Data are expressed as the mean ± SD (n=6).
Abbreviations: F-D-L, F-CONH-PEG-NH-Chol conjugated doxorubicin liposome; F-CONH-PEG-NH-Chol, folate-CONH-PEG-NH-Cholesterol; D-L, PEGylated doxorubicin liposome; Dox, doxorubicin; SD, standard deviation.
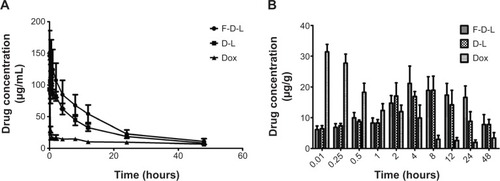
Figure 6 Tissue distribution and percentage of Dox by F-D-L, D-L and free Dox administration in the four organs of mice.
Notes: (A) Tissue distribution of Dox in the heart, liver, spleen, and kidney at 5 minutes, 2 hours, 12 hours, and 24 hours. (B) The percentages of Dox distribution in these organs at their peak concentrations for each formulation. The percentages of Dox distribution in these organs were calculated by the respective Dox weight in each organ divided by the total amount of the Dox in these four organs. The Dox weight in each organ was obtained by multiplying their peak concentration (drug weight/gram tissue) and the weight of the organ. The data are expressed as the mean ± SD (n=6).
Abbreviations: F-D-L, F-CONH-PEG-NH-Chol conjugated doxorubicin liposome; F-CONH-PEG-NH-Chol, folate-CONH-PEG-NH-Cholesterol; D-L, PEGylated doxorubicin liposome; Dox, doxorubicin; SD, standard deviation.
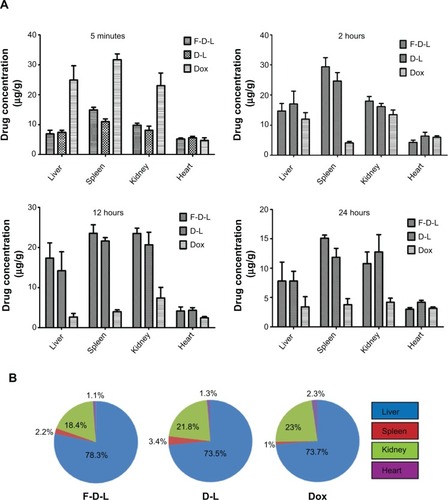
Figure 7 Anti-tumor efficacy of F-D-L, D-L and Dox in tumor bearing mice.
Notes: (A) Tumor bearing mice treated with drugs. The KB cells cultured with folate free medium were inoculated subcutaneously at the front limb and drug was administered by tail vein injection when the tumors grew to 100 mm3. (B) Tumor growth curve. Tumor sizes were determined every other day from the time of drug administration and the volumes were calculated by V =0.52×a×bCitation2, “a” means the long diameters and “b” means the short diameters. (C) Survival curve of tumor bearing mice. The survival of mice was recorded since the mice were inoculated with cancer cells. The drugs were administered at 2 weeks when the tumor grew to 100 mm3. Data are expressed as the mean ± SD (n=6). *P<0.05.
Abbreviations: F-D-L, F-CONH-PEG-NH-Chol conjugated doxorubicin liposome; F-CONH-PEG-NH-Chol, folate-CONH-PEG-NH-Cholesterol; D-L, PEGylated doxorubicin liposome; Dox, doxorubicin; SD, standard deviation.
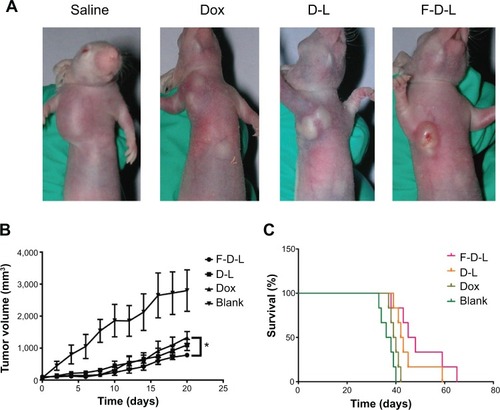
Figure 8 The distribution of Dox in the tumors of treated mice.
Notes: Two hours after injections, mice were sacrificed and tumors were resected and fixed for photography check. (A): (a) saline; (b) free Dox; (c) D-L; (d) F-D-L. (B) The concentration of Dox in the mice treated with Dox, D-L and F-D-L. The tumor tissue was homogenized and Dox concentration was determined on a microplate reader (n=6). *P<0.05; **P<0.01.
Abbreviations: F-D-L, F-CONH-PEG-NH-Chol conjugated doxorubicin liposome; F-CONH-PEG-NH-Chol, folate-CONH-PEG-NH-Cholesterol; D-L, PEGylated doxorubicin liposome; Dox, doxorubicin.
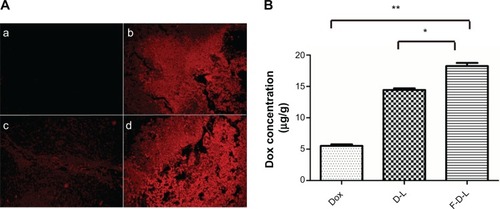
Figure 9 Folate conjugated liposomes have reduced cardiotoxicity.
Notes: (A) Heart/body weight index. (B) GSH-Px enzymatic activities. Data are expressed as the mean ± SD (n=6). *P<0.05.
Abbreviations: F-D-L, F-CONH-PEG-NH-Chol conjugated doxorubicin liposome; F-CONH-PEG-NH-Chol, folate-CONH-PEG-NH-Cholesterol; D-L, PEGylated doxorubicin liposome; Dox, doxorubicin; SD, standard deviation; GSH-Px, glutathione peroxidase.
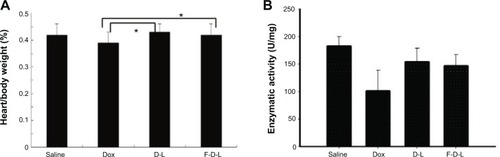
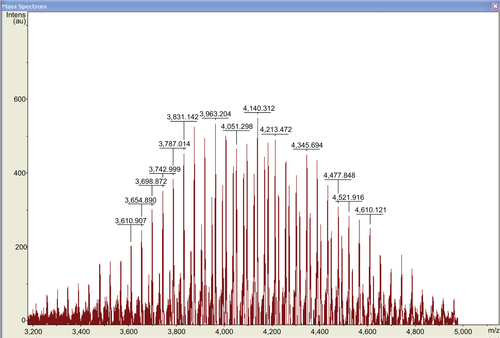
Figure S1 Mass spectrum of F-CONH-PEG-NH-Chol (folate-CONH-PEG-NH-Cholesterol).
Notes: The calculated molecular weight of F-CONH-PEG-NH-Chol is 4,158 Da and the mass spectrum was determined by matrix-assisted laser desorption/ionization/time-of-flight mass spectroscopy. The fragment of F-CONH-PEG-NH-Chol was distributed in a bell shape centered at 4,140 Da, consistent with calculated molecular weight.