
Figures & data
Table 1 Demographics and Clinical Characteristics for HCC Patients
Figure 1 Kaplan-Meier plot of RFS for HCC patients.
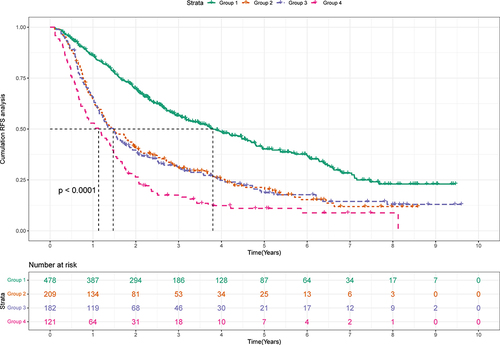
Table 2 Demographics and Clinical Characteristics for Training and Validation Sets
Table 3 Cox Proportional Hazards Regression to Predict Recurrence Based on Lasso Regression
Figure 2 Screening of variables based on Lasso regression. (A) The variation characteristics of the coefficient of variables. (B) the selection process of the optimum value of the parameter λ in the Lasso regression model by cross-validation method.
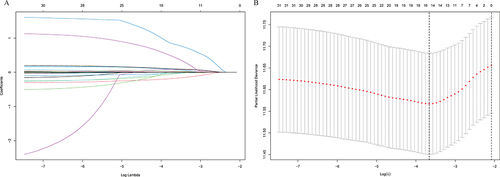
Figure 3 Nomogram, including Age, MLR, GLR, RBC, and INR for 1-, 3-, and 5- years recurrence free survival (RFS) in HCC patients with high HBsAg levels in AFP. The nomogram is valued to obtain the probability of 1-, 3-, and 5- years recurrence by adding up the points identified on the points scale for each variable.
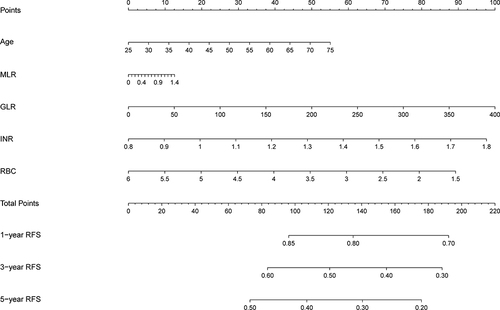
Figure 4 1-, 3-, and 5-year ROC curves of the nomogram in the training cohort.
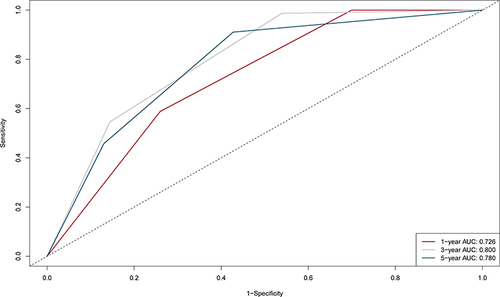
Figure 5 1-, 3-, and 5-year calibration curves of the nomogram in the training cohort.
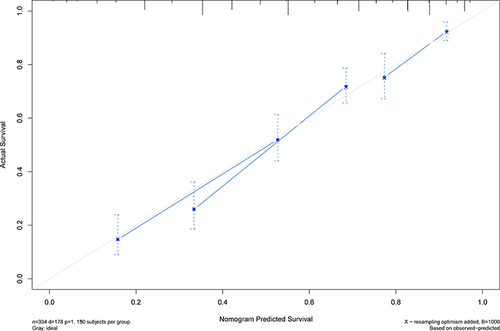
Figure 6 1-, 3-, and 5-year DCA curves of the nomogram in the training cohort. (A) One-year decision curve analysis in the training cohort. (B) Three-year decision curve analysis in the training cohort. (C) Five-year decision curve analysis in the training cohort.
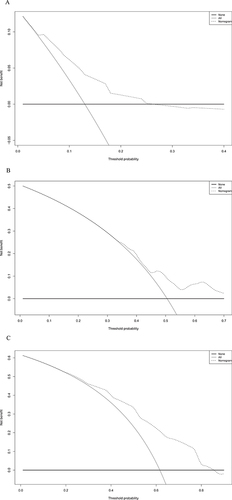
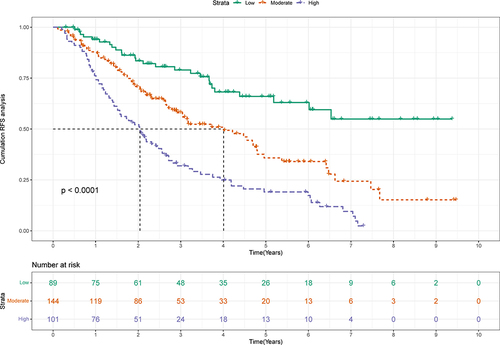
Figure 7 Kaplan-Meier plots of RFS for the low-risk group, intermediate-risk group and high-risk group in the training cohort.
Data Sharing Statement
All relevant data are available within the manuscript and its Supplementary Material Files. Further enquiries can be directed to the corresponding author (Yonghong Zhang, [email protected]).