Figures & data
Table 1 The Primers Used for qPCR Analysis
Figure 1 Effect of surgery and LMK235 treatment on spatial learning in the Morris Water Maze. (A) Experimental design. (B) Mean escape latency of the five major groups in the acquisition phase, n = 24 per group. (C) Average swimming speed of the major groups in the acquisition phase, n = 24 per group. (D) Latency for the first time get to the platform of each group at 1 d before surgery and 1, 3, and 7 d after surgery in the probe trials, n=8 per group. (E) The number of platform crossings with a 60 s limit of each group at 1 d before surgery and 1, 3, and 7 d after surgery in the probe trials, n = 8 per group. (F) Time spent in the target quadrant of each group at 1 d before surgery and 1, 3, and 7 d after surgery in the probe trials, n = 8 per group. (G) Average swimming speed of each group at 1 d before surgery and 1, 3, and 7 d after intervention in the probe trials, n=8 per group. All data are expressed as the means ± SEM. #p < 0.05 versus the day-matched control group. *p < 0.05 versus the day-matched anesthesia group.
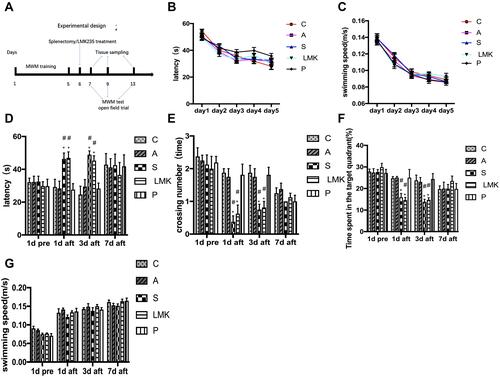
Figure 2 Motor dysfunctions was not evident in each group in open field. Total distance travelled of each group during monitoring in an open field box, n = 8 per group.
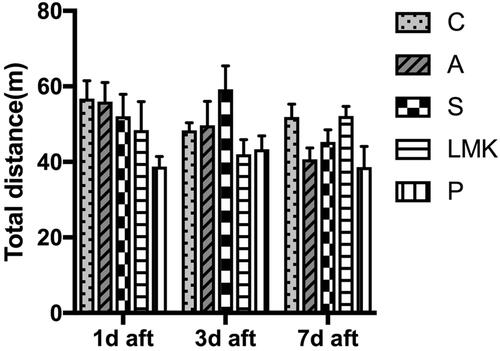
Figure 3 Early peripheral-inflammatory response and neuroinflammation following surgery or LMK235 treatment. (A-C) The serum level of IL-1β, IL-6, and TNF-α on postoperative day 1, 3, and 7 were measured by ELISA, n = 4 per group. Each sample repeated the experiment 3 times. (D–F) Representative Western blots of TNF-α and IL-1β on postoperative days 1, 3, and 7, n = 4 per group. Each sample repeated the experiment 3 times. (G, H) Densitometric analysis of Western blot data from D–F, n = 4 per group. #p < 0.05 versus the day-matched control group. *p < 0.05 versus the day-matched anesthesia group.
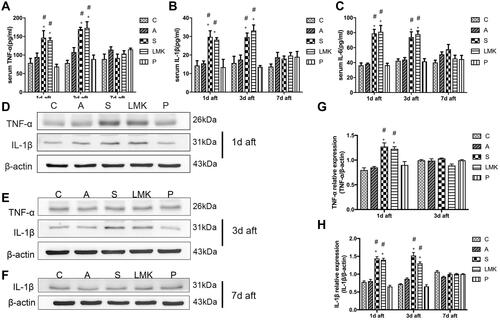
Figure 4 Expression patterns of HDACs in hippocampi from mice that developed postoperative cognitive disorders. (A–E) RT-qPCR analysis of mRNA levels of HDAC1, 2, 4, 5, and 11 from total RNA extracted from the hippocampi of each group, n = 4 per group. Each sample repeated the experiment 3 times. (F–H) Representative Western blots of HDAC4 and HDAC5 on postoperative days 1, 3, and 7, n = 4 per group. Each sample repeated the experiment 3 times. (I, J) Densitometric analysis of Western blot data from (F–H), n=4 per group. #p < 0.05 versus the day-matched control group. *p < 0.05 versus the day-matched anesthesia group.
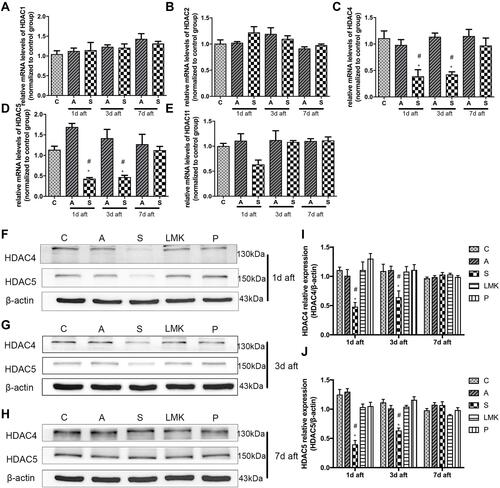
Figure 5 Neurons are a major source of HDAC4 and HDAC5 expression in the hippocampus. Colocalization of HDAC4 with NeuN (part A), IBA (part B), and GFAP (part C). Colocalization of HDAC5 with NeuN (part D), IBA (part E), and GFAP (part F). The colocalization is in yellow in the image. The arrowhead indicates double-labelled cells (part A'; part D'), the arrow shows the protein of interest that is not colocalized with the cell (part B'; part C'; part E'; part F'). The magnified image of the regions is marked with boxes. Scale bar = 100 mm.
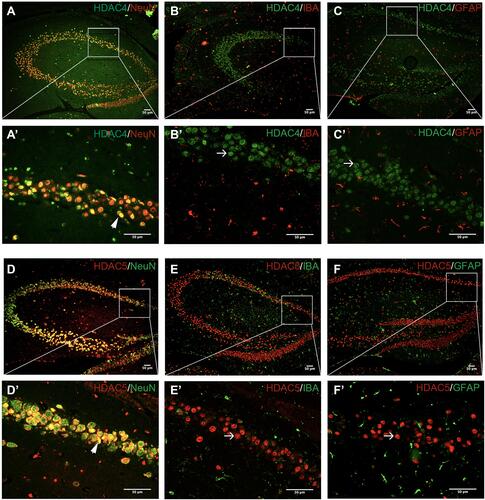
Figure 6 Splenectomy-induced acetylation of HMGB1 expression in the hippocampus. (A–C) Representative Western blots of HMGB1 postoperative day 1, 3, and 7, n = 4 per group. (D) Densitometric analysis of Western blot data from (A–C), n = 4 per group. Each sample repeated the experiment 3 times. (E) Co-immunoprecipitation analysis of hippocampus tissue for acetylated HMGB1 level. Anti-rabbit IgG was used as a negative control. (F) Representative images of double immunofluorescent staining with HMGB1 (green) and DAPI (blue); the arrow indicates the nuclear translocation and release of HMGB1. Scale bar=100 mm. #p < 0.05 versus the day-matched control group. *p < 0.05 versus the day-matched anesthesia group.
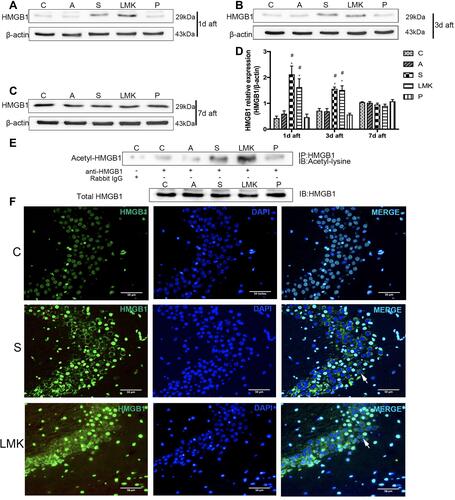
Figure 7 Predominant neuronal expression and release of HMGB1 in the hippocampus. Colocalization of HMGB1 with NeuN, IBA, and GFAP. The co-localization is in yellow in the image. The arrowhead indicates double-labelled cells, the arrow shows the HMGB1, which is not colocalized with the cell. The magnified images of the regions are marked with boxes. Scale bar = 100 mm.
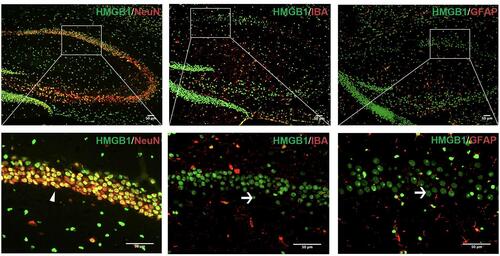
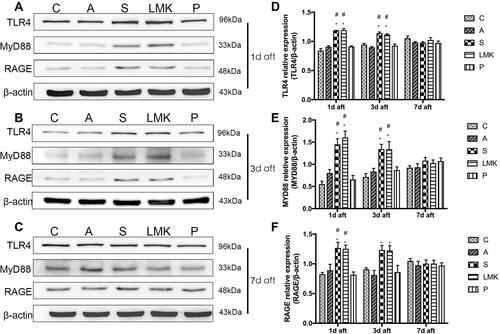
Figure 8 TLR4 and RAGE play a critical role in HMGB1-mediated neuroimmune activation. (A–C) Representative Western blots of TLR4, MyD88, and RAGE on postoperative day 1, 3, and 7, n = 4 per group. Each sample repeated the experiment 3 times. (D–F). Densitometric analysis of Western blot data from (A–C), n = 4 per group. #p < 0.05 versus the day-matched control group. *p < 0.05 versus the day-matched anesthesia group.